20-25 soon?Looks like it has stopped bleeding and trying to recover. I think it can hit target 20-25. All the best.
Tech analysis only and not a financial advise.

Bearish Breakout + Consolidation with Bullish BiasAfter a strong downtrend since 2022, Rivian (RIVN) broke out of its falling channel in late 2023 and has been forming an ascending channel since 2024. This structure suggests a potential medium-term trend reversal.
The price is currently around $13.60, sitting just above the 200-day moving average (MA200) and near a key support area of the ascending channel. This zone presents a potential technical entry point if the structure holds.
Technical Summary:
Higher highs and higher lows since early 2024
MA200 acting as dynamic support
Well-defined ascen
ding channel projecting higher levels
Trade Idea:
Suggested entry: $13.00 – $13.60
Stop loss: $11.90 (below the channel and MA200)
Take profit 1: $16.00
Take profit 2: $20.00
Take p
rofit 3 (extended): $24.00
If the price respects the channel and rebounds from this zone, we could see continued bullish movement toward $16 and potentially higher. If it breaks below $12.00 and loses the MA200, the bullish idea is invalidated.

REDINGTONNSE:REDINGTON
Note :
1. One should go long with a Stop Loss, below the Trendline or the Previous Swing Low.
2. Risk :Reward ratio should be minimum 1:2.
3. Plan your trade as per the Money Management and Risk Appetite.
Disclaimer :
>You are responsible for your profits and loss.
>The idea shared here is purely for Educational purpose.
>Follow back, for more ideas and their notifications on your email.
>Support and Like incase the idea works for you.

ATGLNSE:ATGL
Note :
1. One should go long with a Stop Loss, below the Trendline or the Previous Swing Low.
2. Risk :Reward ratio should be minimum 1:2.
3. Plan your trade as per the Money Management and Risk Appetite.
Disclaimer :
>You are responsible for your profits and loss.
>The idea shared here is purely for Educational purpose.
>Follow back, for more ideas and their notifications on your email.
>Support and Like incase the idea works for you.

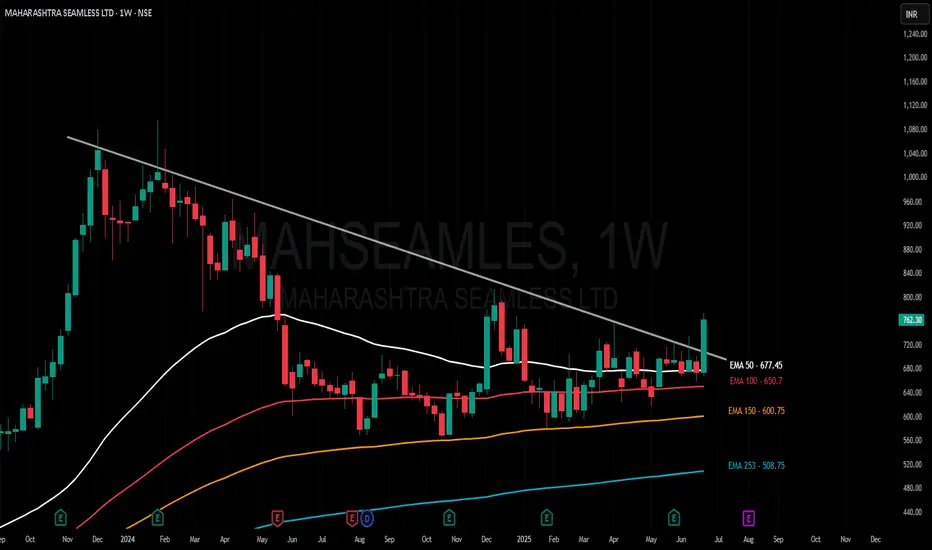
Amazing breakout on WEEKLY Timeframe - MAHSEAMLESCheckout an amazing breakout happened in the stock in Weekly timeframe, macroscopically seen in Daily timeframe. Having a great favor that the stock might be bullish expecting a staggering returns of minimum 25% TGT. IMPORTANT BREAKOUT LEVELS ARE ALWAYS RESPECTED!
NOTE for learners: Place the breakout levels as per the chart shared and track it yourself to get amazed!!
#No complicated chart patterns
#No big big indicators
#No Excel sheet or number magics
TRADE IDEA: WAIT FOR THE STOCK TO BREAKOUT IN WEEKLY TIMEFRAME ABOVE THIS LEVEL.
Checkout an amazing breakout happened in the stock in Weekly timeframe.
Breakouts happening in longer timeframe is way more powerful than the breakouts seen in Daily timeframe. You can blindly invest once the weekly candle closes above the breakout line and stay invested forever. Also these stocks breakouts are lifelong predictions, it means technically these breakouts happen giving more returns in the longer runs. Hence, even when the scrip makes a loss of 10% / 20% / 30% / 50%, the stock will regain and turn around. Once they again enter the same breakout level, they will flyyyyyyyyyyyy like a ROCKET if held in the portfolio in the longer run.
Time makes money, GREEDY & EGO will not make money.
Also, magically these breakouts tend to prove that the companies turn around and fundamentally becoming strong. Also the magic happens when more diversification is done in various sectors under various scripts with equal money invested in each N500 scripts.
The real deal is when to purchase and where to purchase the stock. That is where Breakout study comes into play.
Check this stock which has made an all time low and high chances that it makes a "V" shaped recovery.
> Taking support at last years support or breakout level
> High chances that it reverses from this point.
> Volume dried up badly in last few months / days.
> Very high suspicion based analysis and not based on chart patterns / candle patterns deeply.
> VALUABLE STOCK AVAILABLE AT A DISCOUNTED PRICE
> OPPURTUNITY TO ACCUMULATE ADEQUATE QUANTITY
> MARKET AFTER A CORRECTION / PANIC FALL TO MAKE GOOD INVESTMENT
DISCLAIMER : This is just for educational purpose. This type of analysis is equivalent to catching a falling knife. If you are a warrior, you throw all the knives back else you will be sorrow if it hits SL. Make sure to do your analysis well. This type of analysis only suits high risks investor and whose is willing to throw all the knives above irrespective of any sectoral rotation. BE VERY CAUTIOUS AS IT IS EXTREME BOTTOM FISHING.
HOWEVER, THIS IS HOW MULTIBAGGERS ARE CAUGHT !
STOCK IS AT RIGHT PE / RIGHT EVALUATION / MORE ROAD TO GROW / CORRECTED IV / EXCELLENT BOOKS / USING MARKET CRASH AS AN OPPURTUNITY / EPS AT SKY.
LET'S PUMP IN SOME MONEY AND REVOLUTIONIZE THE NATION'S ECONOMY!
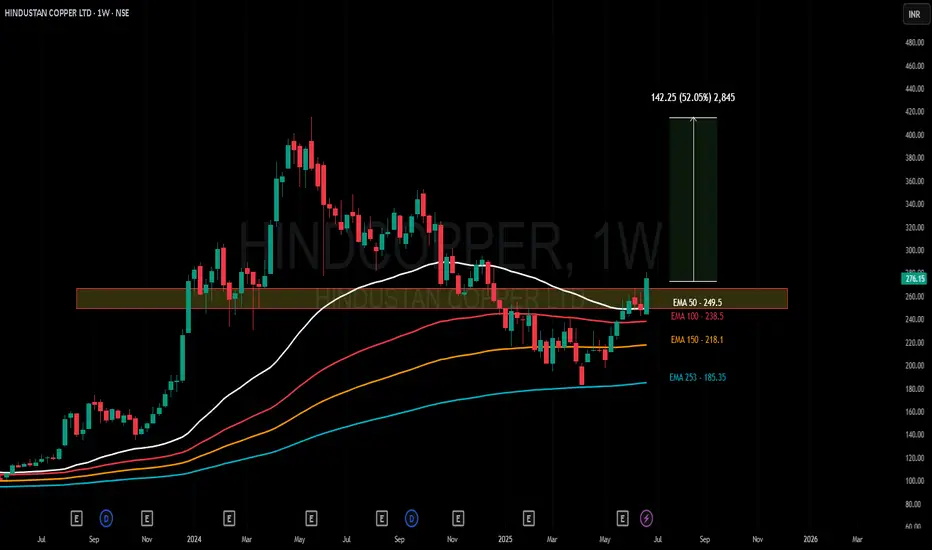
Amazing breakout on WEEKLY Timeframe - HINDCOPPERCheckout an amazing breakout happened in the stock in Weekly timeframe, macroscopically seen in Daily timeframe. Having a great favor that the stock might be bullish expecting a staggering returns of minimum 25% TGT. IMPORTANT BREAKOUT LEVELS ARE ALWAYS RESPECTED!
NOTE for learners: Place the breakout levels as per the chart shared and track it yourself to get amazed!!
#No complicated chart patterns
#No big big indicators
#No Excel sheet or number magics
TRADE IDEA: WAIT FOR THE STOCK TO BREAKOUT IN WEEKLY TIMEFRAME ABOVE THIS LEVEL.
Checkout an amazing breakout happened in the stock in Weekly timeframe.
Breakouts happening in longer timeframe is way more powerful than the breakouts seen in Daily timeframe. You can blindly invest once the weekly candle closes above the breakout line and stay invested forever. Also these stocks breakouts are lifelong predictions, it means technically these breakouts happen giving more returns in the longer runs. Hence, even when the scrip makes a loss of 10% / 20% / 30% / 50%, the stock will regain and turn around. Once they again enter the same breakout level, they will flyyyyyyyyyyyy like a ROCKET if held in the portfolio in the longer run.
Time makes money, GREEDY & EGO will not make money.
Also, magically these breakouts tend to prove that the companies turn around and fundamentally becoming strong. Also the magic happens when more diversification is done in various sectors under various scripts with equal money invested in each N500 scripts.
The real deal is when to purchase and where to purchase the stock. That is where Breakout study comes into play.
Check this stock which has made an all time low and high chances that it makes a "V" shaped recovery.
> Taking support at last years support or breakout level
> High chances that it reverses from this point.
> Volume dried up badly in last few months / days.
> Very high suspicion based analysis and not based on chart patterns / candle patterns deeply.
> VALUABLE STOCK AVAILABLE AT A DISCOUNTED PRICE
> OPPURTUNITY TO ACCUMULATE ADEQUATE QUANTITY
> MARKET AFTER A CORRECTION / PANIC FALL TO MAKE GOOD INVESTMENT
DISCLAIMER : This is just for educational purpose. This type of analysis is equivalent to catching a falling knife. If you are a warrior, you throw all the knives back else you will be sorrow if it hits SL. Make sure to do your analysis well. This type of analysis only suits high risks investor and whose is willing to throw all the knives above irrespective of any sectoral rotation. BE VERY CAUTIOUS AS IT IS EXTREME BOTTOM FISHING.
HOWEVER, THIS IS HOW MULTIBAGGERS ARE CAUGHT !
STOCK IS AT RIGHT PE / RIGHT EVALUATION / MORE ROAD TO GROW / CORRECTED IV / EXCELLENT BOOKS / USING MARKET CRASH AS AN OPPURTUNITY / EPS AT SKY.
LET'S PUMP IN SOME MONEY AND REVOLUTIONIZE THE NATION'S ECONOMY!
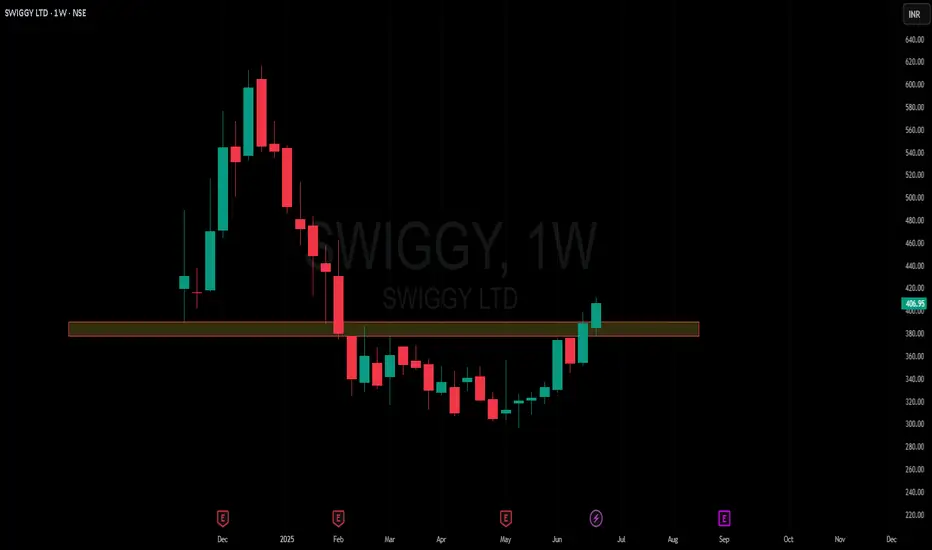
Amazing breakout on WEEKLY Timeframe - SWIGGYCheckout an amazing breakout happened in the stock in Weekly timeframe, macroscopically seen in Daily timeframe. Having a great favor that the stock might be bullish expecting a staggering returns of minimum 25% TGT. IMPORTANT BREAKOUT LEVELS ARE ALWAYS RESPECTED!
NOTE for learners: Place the breakout levels as per the chart shared and track it yourself to get amazed!!
#No complicated chart patterns
#No big big indicators
#No Excel sheet or number magics
TRADE IDEA: WAIT FOR THE STOCK TO BREAKOUT IN WEEKLY TIMEFRAME ABOVE THIS LEVEL.
Checkout an amazing breakout happened in the stock in Weekly timeframe.
Breakouts happening in longer timeframe is way more powerful than the breakouts seen in Daily timeframe. You can blindly invest once the weekly candle closes above the breakout line and stay invested forever. Also these stocks breakouts are lifelong predictions, it means technically these breakouts happen giving more returns in the longer runs. Hence, even when the scrip makes a loss of 10% / 20% / 30% / 50%, the stock will regain and turn around. Once they again enter the same breakout level, they will flyyyyyyyyyyyy like a ROCKET if held in the portfolio in the longer run.
Time makes money, GREEDY & EGO will not make money.
Also, magically these breakouts tend to prove that the companies turn around and fundamentally becoming strong. Also the magic happens when more diversification is done in various sectors under various scripts with equal money invested in each N500 scripts.
The real deal is when to purchase and where to purchase the stock. That is where Breakout study comes into play.
Check this stock which has made an all time low and high chances that it makes a "V" shaped recovery.
> Taking support at last years support or breakout level
> High chances that it reverses from this point.
> Volume dried up badly in last few months / days.
> Very high suspicion based analysis and not based on chart patterns / candle patterns deeply.
> VALUABLE STOCK AVAILABLE AT A DISCOUNTED PRICE
> OPPURTUNITY TO ACCUMULATE ADEQUATE QUANTITY
> MARKET AFTER A CORRECTION / PANIC FALL TO MAKE GOOD INVESTMENT
DISCLAIMER : This is just for educational purpose. This type of analysis is equivalent to catching a falling knife. If you are a warrior, you throw all the knives back else you will be sorrow if it hits SL. Make sure to do your analysis well. This type of analysis only suits high risks investor and whose is willing to throw all the knives above irrespective of any sectoral rotation. BE VERY CAUTIOUS AS IT IS EXTREME BOTTOM FISHING.
HOWEVER, THIS IS HOW MULTIBAGGERS ARE CAUGHT !
STOCK IS AT RIGHT PE / RIGHT EVALUATION / MORE ROAD TO GROW / CORRECTED IV / EXCELLENT BOOKS / USING MARKET CRASH AS AN OPPURTUNITY / EPS AT SKY.
LET'S PUMP IN SOME MONEY AND REVOLUTIONIZE THE NATION'S ECONOMY!
"PYPL Money Grab – Ride the Bull Wave Before the Reversal!"🔥 PAYPAL HEIST ALERT: Bullish Loot Grab Before the Trap! 🔥 (Thief Trading Tactics)
👋 Greetings, Market Bandits & Cash Pirates! 🏴☠️💰
This is not financial advice—just a strategic robbery blueprint for PayPal (PYPL).
🎯 THE MASTER PLAN (Day/Swing Heist)
🔑 Entry (Bullish Swipe):
*"The vault’s cracked—bullish loot is ripe! Enter at ANY PRICE or snipe pullbacks (15m/30m swing lows/highs)."*
🛑 Stop Loss (Escape Route):
Thief’s SL: Recent swing low candle body/wick (3H TF).
Your SL = Your Risk. Adjust for lot size & multiple orders.
📈 Target: 82.00 (or escape earlier if bears ambush!)
⚡ SCALPERS’ NOTE:
Longs ONLY. Hit quick profits? Run. Still hungry? Ride the swing heist!
Trailing SL = Your Getaway Car. 🚗💨
⚠️ DANGER ZONE (Yellow MA):
Overbought | Consolidation | Bear Trap | Trend Reversal Risk!
Take profits early—greed gets caught! 🏆💸
📡 FUNDAMENTAL BACKUP (DYOR!):
Check: COT Reports | Macro Trends | On-Chain Data | Sentiment Shifts 🔍🔗 (.Linnkkss. 👉 is there to read!)
🚨 NEWS ALERT (Volatility Warning!):
Avoid new trades during news.
Trailing SL = Survive the Chaos.
💥 BOOST THE HEIST!
👊 Smash "Like" & "Boost" to fuel our next robbery! More loot = More plans! 🚀
🔔 Stay tuned—next heist coming soon! 🤑🎉

UNHTrendline from many many years ago is intact to the lower bound, I expect to begin to see some strength and gradual drift back up into the 400s

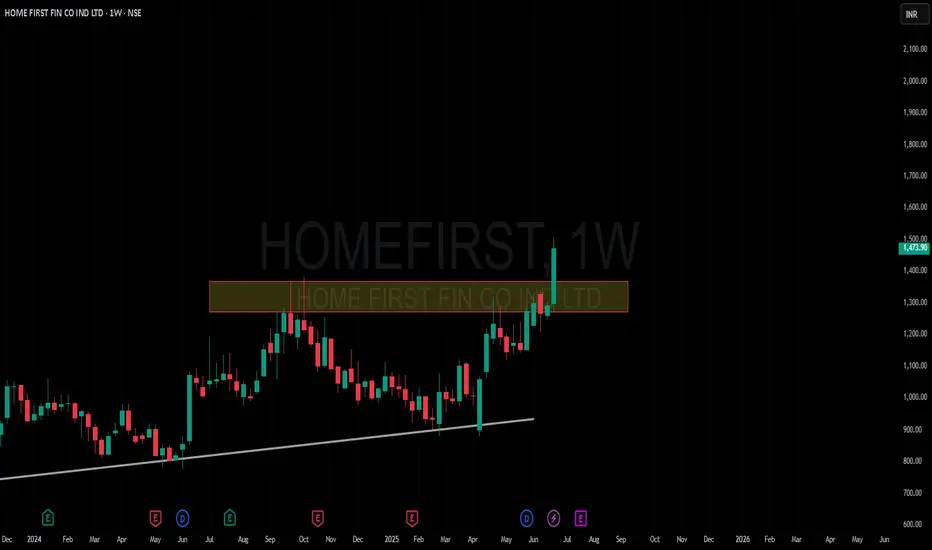
Amazing breakout on WEEKLY Timeframe - HOMEFIRSTCheckout an amazing breakout happened in the stock in Weekly timeframe, macroscopically seen in Daily timeframe. Having a great favor that the stock might be bullish expecting a staggering returns of minimum 25% TGT. IMPORTANT BREAKOUT LEVELS ARE ALWAYS RESPECTED!
NOTE for learners: Place the breakout levels as per the chart shared and track it yourself to get amazed!!
#No complicated chart patterns
#No big big indicators
#No Excel sheet or number magics
TRADE IDEA: WAIT FOR THE STOCK TO BREAKOUT IN WEEKLY TIMEFRAME ABOVE THIS LEVEL.
Checkout an amazing breakout happened in the stock in Weekly timeframe.
Breakouts happening in longer timeframe is way more powerful than the breakouts seen in Daily timeframe. You can blindly invest once the weekly candle closes above the breakout line and stay invested forever. Also these stocks breakouts are lifelong predictions, it means technically these breakouts happen giving more returns in the longer runs. Hence, even when the scrip makes a loss of 10% / 20% / 30% / 50%, the stock will regain and turn around. Once they again enter the same breakout level, they will flyyyyyyyyyyyy like a ROCKET if held in the portfolio in the longer run.
Time makes money, GREEDY & EGO will not make money.
Also, magically these breakouts tend to prove that the companies turn around and fundamentally becoming strong. Also the magic happens when more diversification is done in various sectors under various scripts with equal money invested in each N500 scripts.
The real deal is when to purchase and where to purchase the stock. That is where Breakout study comes into play.
Check this stock which has made an all time low and high chances that it makes a "V" shaped recovery.
> Taking support at last years support or breakout level
> High chances that it reverses from this point.
> Volume dried up badly in last few months / days.
> Very high suspicion based analysis and not based on chart patterns / candle patterns deeply.
> VALUABLE STOCK AVAILABLE AT A DISCOUNTED PRICE
> OPPURTUNITY TO ACCUMULATE ADEQUATE QUANTITY
> MARKET AFTER A CORRECTION / PANIC FALL TO MAKE GOOD INVESTMENT
DISCLAIMER : This is just for educational purpose. This type of analysis is equivalent to catching a falling knife. If you are a warrior, you throw all the knives back else you will be sorrow if it hits SL. Make sure to do your analysis well. This type of analysis only suits high risks investor and whose is willing to throw all the knives above irrespective of any sectoral rotation. BE VERY CAUTIOUS AS IT IS EXTREME BOTTOM FISHING.
HOWEVER, THIS IS HOW MULTIBAGGERS ARE CAUGHT !
STOCK IS AT RIGHT PE / RIGHT EVALUATION / MORE ROAD TO GROW / CORRECTED IV / EXCELLENT BOOKS / USING MARKET CRASH AS AN OPPURTUNITY / EPS AT SKY.
LET'S PUMP IN SOME MONEY AND REVOLUTIONIZE THE NATION'S ECONOMY!
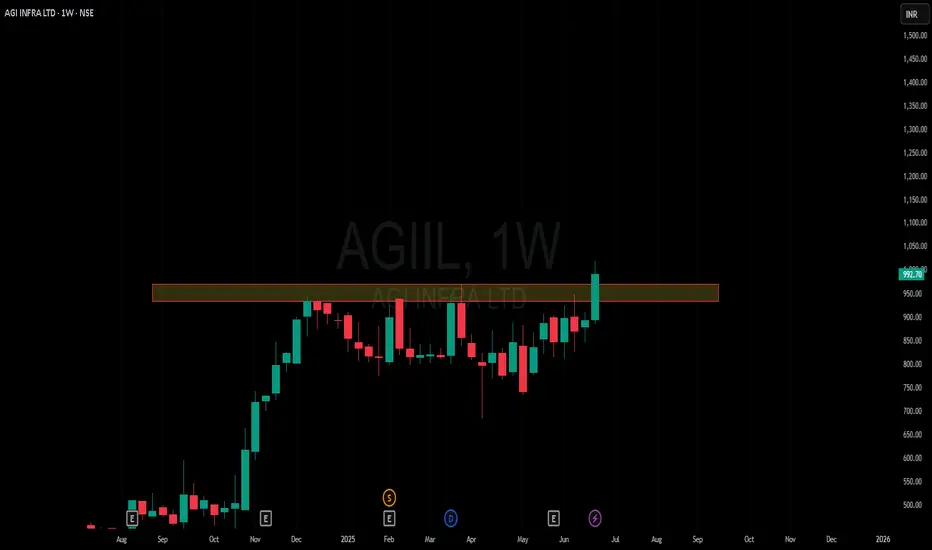
Amazing breakout on WEEKLY Timeframe - AGIILCheckout an amazing breakout happened in the stock in Weekly timeframe, macroscopically seen in Daily timeframe. Having a great favor that the stock might be bullish expecting a staggering returns of minimum 25% TGT. IMPORTANT BREAKOUT LEVELS ARE ALWAYS RESPECTED!
NOTE for learners: Place the breakout levels as per the chart shared and track it yourself to get amazed!!
#No complicated chart patterns
#No big big indicators
#No Excel sheet or number magics
TRADE IDEA: WAIT FOR THE STOCK TO BREAKOUT IN WEEKLY TIMEFRAME ABOVE THIS LEVEL.
Checkout an amazing breakout happened in the stock in Weekly timeframe.
Breakouts happening in longer timeframe is way more powerful than the breakouts seen in Daily timeframe. You can blindly invest once the weekly candle closes above the breakout line and stay invested forever. Also these stocks breakouts are lifelong predictions, it means technically these breakouts happen giving more returns in the longer runs. Hence, even when the scrip makes a loss of 10% / 20% / 30% / 50%, the stock will regain and turn around. Once they again enter the same breakout level, they will flyyyyyyyyyyyy like a ROCKET if held in the portfolio in the longer run.
Time makes money, GREEDY & EGO will not make money.
Also, magically these breakouts tend to prove that the companies turn around and fundamentally becoming strong. Also the magic happens when more diversification is done in various sectors under various scripts with equal money invested in each N500 scripts.
The real deal is when to purchase and where to purchase the stock. That is where Breakout study comes into play.
Check this stock which has made an all time low and high chances that it makes a "V" shaped recovery.
> Taking support at last years support or breakout level
> High chances that it reverses from this point.
> Volume dried up badly in last few months / days.
> Very high suspicion based analysis and not based on chart patterns / candle patterns deeply.
> VALUABLE STOCK AVAILABLE AT A DISCOUNTED PRICE
> OPPURTUNITY TO ACCUMULATE ADEQUATE QUANTITY
> MARKET AFTER A CORRECTION / PANIC FALL TO MAKE GOOD INVESTMENT
DISCLAIMER : This is just for educational purpose. This type of analysis is equivalent to catching a falling knife. If you are a warrior, you throw all the knives back else you will be sorrow if it hits SL. Make sure to do your analysis well. This type of analysis only suits high risks investor and whose is willing to throw all the knives above irrespective of any sectoral rotation. BE VERY CAUTIOUS AS IT IS EXTREME BOTTOM FISHING.
HOWEVER, THIS IS HOW MULTIBAGGERS ARE CAUGHT !
STOCK IS AT RIGHT PE / RIGHT EVALUATION / MORE ROAD TO GROW / CORRECTED IV / EXCELLENT BOOKS / USING MARKET CRASH AS AN OPPURTUNITY / EPS AT SKY.
LET'S PUMP IN SOME MONEY AND REVOLUTIONIZE THE NATION'S ECONOMY!
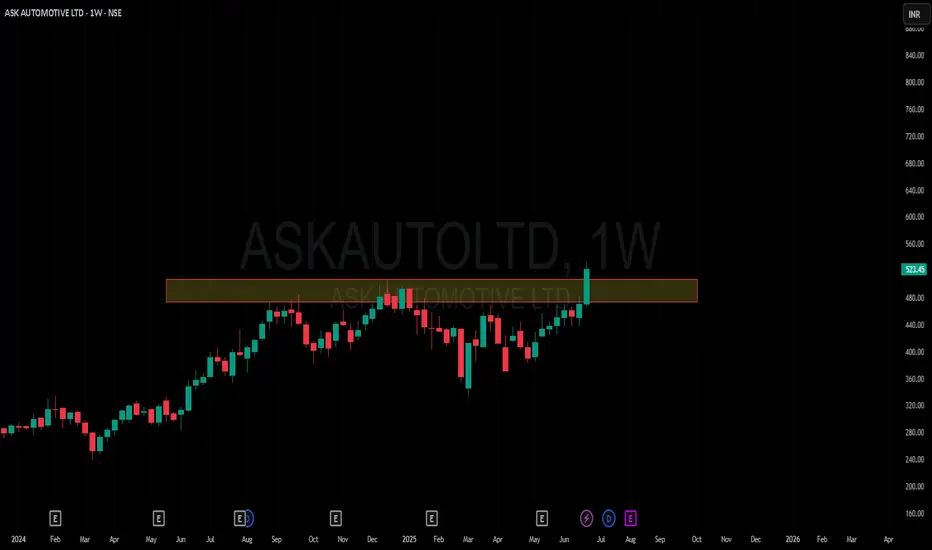
Amazing breakout on WEEKLY Timeframe - ASKAUTOLTDCheckout an amazing breakout happened in the stock in Weekly timeframe, macroscopically seen in Daily timeframe. Having a great favor that the stock might be bullish expecting a staggering returns of minimum 25% TGT. IMPORTANT BREAKOUT LEVELS ARE ALWAYS RESPECTED!
NOTE for learners: Place the breakout levels as per the chart shared and track it yourself to get amazed!!
#No complicated chart patterns
#No big big indicators
#No Excel sheet or number magics
TRADE IDEA: WAIT FOR THE STOCK TO BREAKOUT IN WEEKLY TIMEFRAME ABOVE THIS LEVEL.
Checkout an amazing breakout happened in the stock in Weekly timeframe.
Breakouts happening in longer timeframe is way more powerful than the breakouts seen in Daily timeframe. You can blindly invest once the weekly candle closes above the breakout line and stay invested forever. Also these stocks breakouts are lifelong predictions, it means technically these breakouts happen giving more returns in the longer runs. Hence, even when the scrip makes a loss of 10% / 20% / 30% / 50%, the stock will regain and turn around. Once they again enter the same breakout level, they will flyyyyyyyyyyyy like a ROCKET if held in the portfolio in the longer run.
Time makes money, GREEDY & EGO will not make money.
Also, magically these breakouts tend to prove that the companies turn around and fundamentally becoming strong. Also the magic happens when more diversification is done in various sectors under various scripts with equal money invested in each N500 scripts.
The real deal is when to purchase and where to purchase the stock. That is where Breakout study comes into play.
Check this stock which has made an all time low and high chances that it makes a "V" shaped recovery.
> Taking support at last years support or breakout level
> High chances that it reverses from this point.
> Volume dried up badly in last few months / days.
> Very high suspicion based analysis and not based on chart patterns / candle patterns deeply.
> VALUABLE STOCK AVAILABLE AT A DISCOUNTED PRICE
> OPPURTUNITY TO ACCUMULATE ADEQUATE QUANTITY
> MARKET AFTER A CORRECTION / PANIC FALL TO MAKE GOOD INVESTMENT
DISCLAIMER : This is just for educational purpose. This type of analysis is equivalent to catching a falling knife. If you are a warrior, you throw all the knives back else you will be sorrow if it hits SL. Make sure to do your analysis well. This type of analysis only suits high risks investor and whose is willing to throw all the knives above irrespective of any sectoral rotation. BE VERY CAUTIOUS AS IT IS EXTREME BOTTOM FISHING.
HOWEVER, THIS IS HOW MULTIBAGGERS ARE CAUGHT !
STOCK IS AT RIGHT PE / RIGHT EVALUATION / MORE ROAD TO GROW / CORRECTED IV / EXCELLENT BOOKS / USING MARKET CRASH AS AN OPPURTUNITY / EPS AT SKY.
LET'S PUMP IN SOME MONEY AND REVOLUTIONIZE THE NATION'S ECONOMY!
LONG 4HR Wave Count Possibilities
Using the Weekly time frame, Wave 1+3 of a larger degree shows a possible extension to the 1.68 extension which is a common wave 5 of a larger degree target . That Price Target being $26.35.
In April of this year the price reacted to a Reversal Pivot Point but failed to form a proper impulse for wave 1. Price then gapped above the price resistance line for the year of 2025 and the 100 WMA.
As of now, price is expect to target $19.43 in a move to finish out wave 3 of a macro degree. Wave 4 typically retracing to the 0.236 or 0.382 level has been displayed to align with the current uptrend trendline.
I have also displayed the possible points of interest for Fib levels for an approach to finish out wave 5 of a macro degree. I expect Price to stall and face resistance in the golden pocket extension of the Fib levels.
None of this is financial advise and strictly for educational purpouses.

Amazing breakout on WEEKLY Timeframe - NUVAMACheckout an amazing breakout happened in the stock in Weekly timeframe, macroscopically seen in Daily timeframe. Having a great favor that the stock might be bullish expecting a staggering returns of minimum 25% TGT. IMPORTANT BREAKOUT LEVELS ARE ALWAYS RESPECTED!
NOTE for learners: Place the breakout levels as per the chart shared and track it yourself to get amazed!!
#No complicated chart patterns
#No big big indicators
#No Excel sheet or number magics
TRADE IDEA: WAIT FOR THE STOCK TO BREAKOUT IN WEEKLY TIMEFRAME ABOVE THIS LEVEL.
Checkout an amazing breakout happened in the stock in Weekly timeframe.
Breakouts happening in longer timeframe is way more powerful than the breakouts seen in Daily timeframe. You can blindly invest once the weekly candle closes above the breakout line and stay invested forever. Also these stocks breakouts are lifelong predictions, it means technically these breakouts happen giving more returns in the longer runs. Hence, even when the scrip makes a loss of 10% / 20% / 30% / 50%, the stock will regain and turn around. Once they again enter the same breakout level, they will flyyyyyyyyyyyy like a ROCKET if held in the portfolio in the longer run.
Time makes money, GREEDY & EGO will not make money.
Also, magically these breakouts tend to prove that the companies turn around and fundamentally becoming strong. Also the magic happens when more diversification is done in various sectors under various scripts with equal money invested in each N500 scripts.
The real deal is when to purchase and where to purchase the stock. That is where Breakout study comes into play.
Check this stock which has made an all time low and high chances that it makes a "V" shaped recovery.
> Taking support at last years support or breakout level
> High chances that it reverses from this point.
> Volume dried up badly in last few months / days.
> Very high suspicion based analysis and not based on chart patterns / candle patterns deeply.
> VALUABLE STOCK AVAILABLE AT A DISCOUNTED PRICE
> OPPURTUNITY TO ACCUMULATE ADEQUATE QUANTITY
> MARKET AFTER A CORRECTION / PANIC FALL TO MAKE GOOD INVESTMENT
DISCLAIMER : This is just for educational purpose. This type of analysis is equivalent to catching a falling knife. If you are a warrior, you throw all the knives back else you will be sorrow if it hits SL. Make sure to do your analysis well. This type of analysis only suits high risks investor and whose is willing to throw all the knives above irrespective of any sectoral rotation. BE VERY CAUTIOUS AS IT IS EXTREME BOTTOM FISHING.
HOWEVER, THIS IS HOW MULTIBAGGERS ARE CAUGHT !
STOCK IS AT RIGHT PE / RIGHT EVALUATION / MORE ROAD TO GROW / CORRECTED IV / EXCELLENT BOOKS / USING MARKET CRASH AS AN OPPURTUNITY / EPS AT SKY.
LET'S PUMP IN SOME MONEY AND REVOLUTIONIZE THE NATION'S ECONOMY!

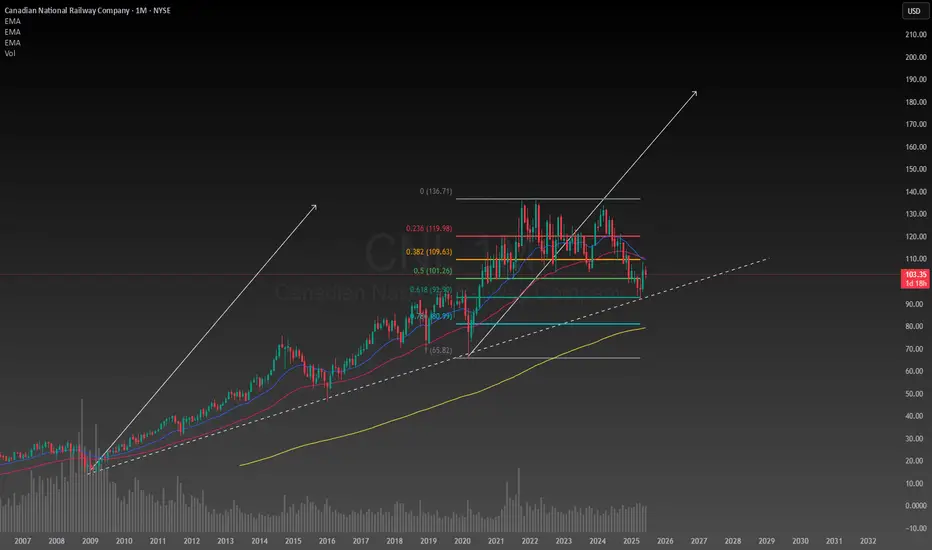
Canadian National Railway has huge upside potentialA decades old trendline still unbroken after months of correction, the Canadian economy seems to be in a great position considering the circumstances. After conducting a simple technical analysis predicting a second leg up the upside potential is enormous if I am right about this. The downside is I am looking at a monthly chart so this will need to be a position trade or long term investment to achieve the desired results. Even if my target is reached I will likely hold onto the stock for years afterwards because the company will continue to make money. The intrinsic value for CNI is between $120 and $225 so it is well below the intrinsic value making any new position on it now at a bargain deal. I will likely be allocating a significant portion of my portfolio to it in the next few days to weeks.
$MSFT✅ NASDAQ:MSFT trading up to $500/share
If investors are willing to pay that, it usually reflects:
Strong earnings growth and outlook
Confidence in expansion into high-demand sectors (AI, cloud, cybersecurity)
The sense that Microsoft has durable “moats” meaning customers and other systems are increasingly dependent on their software and infrastructure

AMGN Long Trade Setup!📈
🕒 Timeframe: 30 min
🔻 Pattern: Falling wedge nearing breakout 🔼
📍 Entry Zone: ~$277.00 ✅
🎯 Target: $283.35 💰
🛑 Stop Loss: Below $274.00 ⚠️
🔥 Why It Looks Bullish:
🔺 Falling wedge structure — a known bullish pattern
🧱 Strong bounce off demand zone (support + yellow line)
💚 Green reversal candle forming at wedge tip
📈 Risk-to-reward ratio is attractive for swing/short-term

SANM Long Trade Setup!📈
🕒 Timeframe: 30 min
📍 Entry: ~$98.00 ✅
🎯 Target: $100.22 💰
🛑 Stop Loss: Below $96.00 🚫
📏 Pattern: Bull flag breakout ⬆️ with consolidation
🔥 Why This Looks Strong:
📈 Strong uptrend with clear bullish structure
⬛ Flag/pennant breakout with volume surge 🔊
✍️ Breakout from consolidation above key support
💪 Price holding above previous resistance (now support)

SMCI Long Trade Setup!📈
🕒 Timeframe: 30 min
📉 Pattern: Falling wedge breakout 🔼
📍 Entry: Around $47.50 ✅
🎯 Target: $50.03 💰
🛑 Stop Loss: Below $46.40 🚫
🔍 Why This Trade?
🔓 Breakout from falling wedge — bullish sign
🧱 Strong trendline + horizontal support
📊 Volume surge = smart money interest
🕯️ Bullish candle = potential momentum play

Long 4HR AND Weekly ( Finishing Wave 1)
4HR
NASDAQ:AMD is close to potentially finishing Wave 5 of a larger degree wave 1.
$154 is the calculate Fib extension of Wave 1+3 for a wave 5 however, there is plenty room for the stock to run with multiple $160+ Analyst upgrades.
From the Close Price on 6/27 to $160 there is a potential 11% upside.
I believe any negative sentiment on trade with Canada will dissipate sooner than later as we seen throughout the entirety of the year so far with all trade talks failing to hold the markets down.
WEEKLY
The MACD has finally finished above the neutral zone increasing bullish sentiment and strength on this one moving forward as this is a bullish signal.
On both time frames this is a very clear breakout against the Multi year Resistance channel from its previous ATH with price against within the channel showing tons of strength in momentum.
A further outlook for this stock shows a possible wave 3 on the weekly chart targeting the upper trendline at over $300.
If you feel you missed the opportunity to get a long term position, there is always a second chance on on micro wave 2. That would give you retracements down to $100, $110, and $120. I'm rounding up the Fib levels for simplicity.
I currently hold 100 shares at an average of $118 and look to add more beneath my average.
I also am holding multiple contracts with a $140 strike out until the end of July and $160 strike out until September. I do not plan on trimming any contracts until the $150 stock price.
Use this information for educational purposes only as this is not financial advice.

BellRing Brands (BRBR) Weekly Gartley@ Key Levels + Kijun SignalIn March 2025, I previously took a look at this budding public company BellRing Brands, Inc. for a long-term investment horizon. It was priced around 74 at the time, then the fall of the overall market status put additional pressure on its stock, although the company itself is booming and meets my fundamental parameters. See the following:
Since then, we had an awesome and confident forward guidance from the company in the last earnings call in May 2025: bellring.com
Now, looking at BellRing Brands (BRBR) once again, on a weekly chart, key technical patterns have formed that look very promising and solid with its many confluences.
TECHNICALS:
WEEKLY:
Many weekly confluences have appeared from a technical perspective. Here is what I see:
(1) There is a clear Bullish Gartley-ish pattern in a weekly retracement to 50% followed by a retracement to 78.6% of a preceding move.
(2) The price is around 78% fib support.
(3) Horizontal area of support: The 50 - 58 area is a whole prior area of horizontal support that was a prior resistance area back in July 2024, and the price has landed back on that area. You know what we say as technicians and investors: past resistance = future support.
(4) MACD Hidden Bullish Divergence (weekly)
(5) The price tested the weekly cloud and broke through; however, bullish extremes were triggered when that happen, which is rare based on all my personal studies. In fact, the current level 55-58 marks the end of a bearish double top cycle that began around March 2025.
(6) A weekly Doji with volume support (classified as a "dVa" in my old notes of Volume Price Analysis).
Here is the weekly chart:
MONTHY:
BRBR is poised to rally Q3 and Q4 2025.
We have a potential monthly bounce of the kijun forthcoming along with good fundamentals going forward supporting the growth of the company in the long term.
** potential monthly Kijun Trend Bounce **
Here is the monthly chart:
Target:
Currently, the price is 58.54. My tentative target is around 140 by March 2026.
Thus, with all the fundamental support, good forward-looking guidance, and the technical I believe that BellRing Brands (BRBR) is at a great price right now. It is prime to continue its stretch of growth for 2025. Looking forward with investor foresight, the case for BellRing Brands and its stock (BRBR) is not only a high-probability outlook of positivity, but a high odds outcome of technical price pattern success. What a great discount.... :)

super sell on the run for TSLAwe looking for sells on this pair as you can see there is a trend moving up but there is likly to have a short sells going on now

Light at the end of the Tunnel for AAPLI have been tracking this pattern that NASDAQ:AAPL started forming in April for some time now.
This is a classic symmetrical triangle formation with significant consolidation in the last trading sessions. This patterns typically lead to a breakout in either direction, and since price is near the apex, a breakout is imminent within 1–3 trading sessions.
Current Price: $201.60 (slightly above the key $201 support/resistance zone).
Key Support: $198.62 (recent higher low).
Major Support: $189.10 (multi-month low).
Resistance Zone: $202.30 (pre-market), then $210.45 (EMA 200/50 convergence).
EMA 50/200 Cross: Both EMAs are converging at ~$210.45, which has become a significant resistance ceiling.
Typically, this is bearish when price is below both 50 and 200 EMA. However, the MACD and RSI indicators both support an imminent bullish move forming with an increase in volume.
With headwinds from antitrust issues in the EU and U.S. I wont be surprised if this breaks out significantly upwards with some positive news acting as the catalyst.
The conservative trader will place a straddle aiming for $210.45 (EMA resistance) upside and but $192–194 (prior demand zone) downside.
The riskier and probably more rewarding bet would be to place a call aiming for the $218-$224 resistance zone after this breaks $202.30
