Roche Strengthens Its Bet Against the “Superbug”By Ion Jauregui – Analyst at ActivTrades
Zosurabalpin: A New Hope Against Antimicrobial Resistance
Swiss pharmaceutical giant Roche (SWX: ROG) has just taken a major step forward in the fight against bacterial resistance: its new antibiotic zosurabalpin is entering Phase 3 clinical trials. The compound targets acinetobacter baumannii, a highly resistant Gram-negative bacterium that causes serious infections such as pneumonia and sepsis, with mortality rates ranging from 40% to 60%, according to Larry Tsai, Chief Medical Officer at Genentech, Roche’s U.S. subsidiary.
The clinical trial is set to begin in late 2025 or early 2026, involving approximately 400 patients across more than 100 international sites. If successful, zosurabalpin would become the first new class of antibiotics targeting Gram-negative bacteria in over 50 years, marking a historic milestone in pharmaceutical development.
Strategic Return to the Antibiotics Arena
After stepping away from antibiotic research for several years, Roche re-entered the field in the past decade, just as the WHO warned of the growing threat of antimicrobial resistance, which could lead to up to 10 million deaths annually by 2050. This move underlines Roche’s renewed commitment to innovation in critical areas of global health.
Economic Context and Market Position
So far in 2025, Roche has delivered mixed financial results. In its first-quarter report, revenue grew 2% year-on-year, driven by its diagnostics division, while its oncology segment remains solid. However, margin pressures persist, and the biotech landscape remains fiercely competitive.
On the stock market, Roche shares have remained relatively stable around 250 Swiss francs, with investors showing caution toward the company’s pace of innovation in the post-pandemic era. The move to Phase 3 for zosurabalpin may shift that perception and position Roche as a pioneer in a long-overlooked segment of the pharmaceutical industry: next-generation antibiotics.
Technical Analysis
The stock has been trading within a range between 249.6 and 303.2 francs, peaking at 323.6 francs in late March, followed by a sharp correction that found support at 244 francs in early April. The current point of control lies slightly below the midpoint of the range at 263 francs. The RSI sits at 49.11%, indicating a relatively balanced momentum. Moving average crossovers suggest a potential price correction, as the 200-day average recently crossed below the 50-day average.
Conclusion
Roche’s latest advance could not only save thousands of lives but also restore the company’s leadership in the fight against infectious diseases. If all goes according to plan, zosurabalpin could be available before 2030, ushering in a new era in modern medicine.
*******************************************************************************************
The information provided does not constitute investment research. The material has not been prepared in accordance with the legal requirements designed to promote the independence of investment research and such should be considered a marketing communication.
All information has been prepared by ActivTrades ("AT"). The information does not contain a record of AT's prices, or an offer of or solicitation for a transaction in any financial instrument. No representation or warranty is given as to the accuracy or completeness of this information.
Any material provided does not have regard to the specific investment objective and financial situation of any person who may receive it. Past performance is not reliable indicator of future performance. AT provides an execution-only service. Consequently, any person acting on the information provided does so at their own risk.

INOX WIND BREAKOUT Target Levels
- Short-Term Target: 204–211.
- Medium-Term Target: 261–343
Stop-Loss Levels
- Short-Term Stop Loss: 184.2 near immediate support
- Medium-Term Stop Loss: 157.1–153.8 strong support zone
- Long-Term Stop Loss: 170.6 major trend support

Technical Analysis of Hindustan Zinc - Buy & HoldLet's analyze Hindustan Zinc (HINDZINC) based on the chart.
Current Status and Observations:
Chart Type: Weekly Candlestick Chart.
Current Price: Approximately INR 455.30 (as per the blue box on the right).
Recent Action: The stock has recently broken above a "Monthly Breakout @408.90" and retested "Retest after Monthly Breakout @428.75". This indicates a bullish reversal or continuation from a support level.
RSI (Relative Strength Index): The RSI is at 47.39, which is in a neutral zone but showing an upward trend, suggesting increasing momentum.
Volume: The volume bar for the current week appears to be significant, supporting the recent upward movement.
Resistance Levels:
Weekly Resistance @482.50
Daily Target TP1 @516.50
4H Target TP2 @562.50
3H Target TP3 @590.00
Buy Price and Targets:
Given the recent breakout and retest, along with the increasing RSI, Hindustan Zinc appears to be in a favorable position for a buy.
Optimal Buy Zone: The ideal buy zone would have been closer to the retest level of INR 428.75. However, given the current price, a buy at current levels (around INR 455 - 460) is still viable, provided the breakout holds. Traders might consider buying on minor dips towards INR 445-450 if they occur.
Near-Term Targets:
Target 1 (Short-term/Swing Trade): INR 482.50 (Weekly Resistance). This is the immediate hurdle.
Target 2 (Mid-term): INR 516.50 (Daily Target TP1). Once Target 1 is cleared, this becomes the next logical objective.
Target 3 (Mid to Long-term): INR 562.50 (4H Target TP2). This level offers a significant upside potential.
Target 4 (Longer-term/Aggressive): INR 590.00 (3H Target TP3). This is the highest target indicated and suggests a strong upward trajectory if momentum continues.
Position and Duration:
Buy Position: Yes, initiate a buy. The chart indicates a constructive setup.
Hold Position with Duration:
For Short-Term Traders (Swing Trading): Hold for a duration of 1 to 4 weeks aiming for Target 1 (INR 482.50) and potentially Target 2 (INR 516.50). Monitor price action closely at resistance levels.
For Mid-Term Investors: Hold for a duration of 1 to 3 months aiming for Target 3 (INR 562.50).
For Long-Term Investors: Hindustan Zinc is a fundamental company, and if the broader market and commodity prices remain supportive, it could be a longer-term hold. For the targets shown on the chart, a duration of 3 to 6 months+ could be considered for reaching Target 4 (INR 590.00) or beyond.
Important Considerations and Risk Management:
Stop Loss: A crucial part of any trade is a stop loss. A logical stop loss could be placed just below the retest level or the monthly breakout level, for example, around INR 420-425. A tighter stop could be just below the current week's low if you have a shorter time horizon.
Volume Confirmation: Continue to monitor volume. Strong buying interest confirmed by rising volume is a positive sign.
Global Commodity Prices: Hindustan Zinc's performance is highly correlated with global zinc and other metal prices. Keep an eye on commodity market trends.
Company Fundamentals: While this analysis is purely technical, it's always advisable to have a basic understanding of the company's fundamentals and any upcoming news or events.
Market Volatility: The market can be volatile. Be prepared for fluctuations and adjust your strategy accordingly.
In summary, Hindustan Zinc presents a compelling technical setup for a buy, with clear targets in the near to mid-term. However, proper risk management with a defined stop loss is paramount.
Disclaimer: This is not financial advice. Always conduct your own analysis before trading. We are not responsible for your loss. Do your own research before buying this stock.

Sail BullishAfter a long consolidation at the bottom Sail has formed a Bullish engulfing candle at the bottom and giving a breakout of the resistance level.
Entry- 111-112
Support- 107.5-107
Target- 120, 125
Disclaimer- This is just for educational purpose please take advice from your financial advisor before making any decision.
Jai Shree Ram


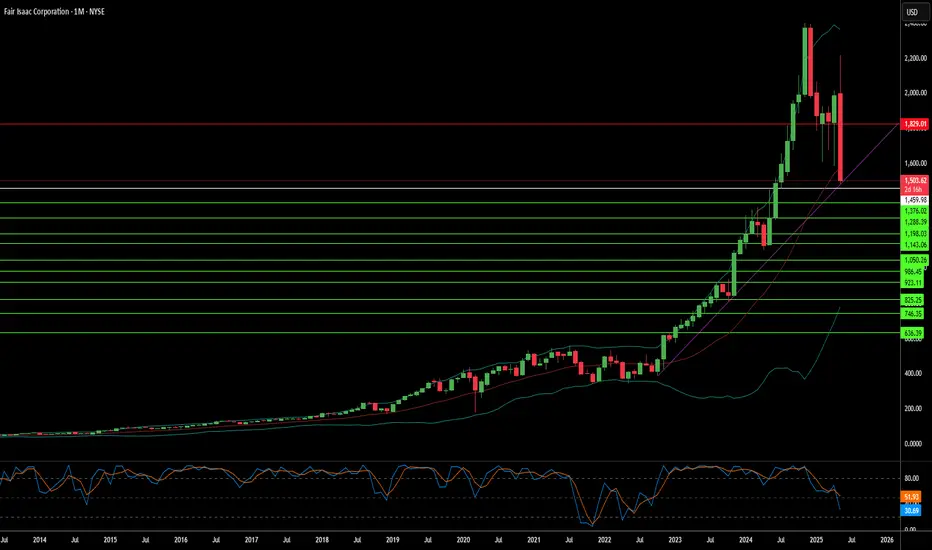
FICO's Monopoly: Cracks in the Credit Kingdom?For decades, Fair Isaac Corporation (FICO) has maintained an unparalleled grip on the American credit system. Its FICO score became the de facto standard for assessing creditworthiness, underpinning virtually every mortgage, loan, and credit card. This dominance was cemented by a highly profitable business model: the three major credit bureaus—Equifax, Experian, and TransUnion—each paid FICO for independent licenses, generating a significant percentage of revenue per inquiry and establishing a seemingly unassailable monopoly.
However, this long-standing reign now faces an unprecedented challenge. The Federal Housing Finance Agency (FHFA) Director, Bill Pulte, recently signaled a potential shift to a "2-out-of-3" model for credit bureaus. This seemingly technical adjustment carries profound implications, as it could render one of FICO's three bureau licenses redundant, potentially evaporating up to 33% of its highly profitable revenue. Director Pulte has also publicly criticized FICO's recent 41% increase in wholesale mortgage score fees, contributing to significant declines in FICO's stock price and drawing broader regulatory scrutiny over its perceived anti-competitive practices.
This regulatory pressure extends beyond FICO's immediate revenue, hinting at a broader dismantling of the traditional credit monopoly. The FHFA's actions could pave the way for alternative credit scoring models, like VantageScore, and encourage innovation from fintech companies and other data sources. This increased competition threatens to reshape the landscape of credit assessment, potentially leading to a more diversified and competitive market where FICO's once-unchallenged position is significantly diluted.
Despite these formidable headwinds, FICO retains considerable financial strength, boasting impressive profit margins and robust revenue growth, particularly within its Scores segment. The company's Software segment, offering a decision intelligence platform, also presents a significant growth opportunity, with projected increases in annual recurring revenue. While FICO navigates this pivotal period of regulatory scrutiny and emerging competition, its ability to adapt and leverage its diversified business will be crucial in determining its future role in the evolving American credit market.
Buy Idea for MQG (Macquarie Group Ltd)📈 Buy Idea – MQG.ASX
🔹 Entry: $210.49
🔹 Stop: $201.80 (Risk ~4.1%)
🔹 Target 1: $227.50
🔹 Target 2: $238+
🔹 R:R: ~1:3
Setup:
– Tight sideways consolidation near 50MA
– Strong volume support near $205 zone
– Bullish engulfing candle into breakout zone
– Sector strength: Financials stabilizing post RBA cut
– Clean technical base + upside momentum potential
Why It Works:
🔸 High-quality name with macro tailwind (lower rates = banking boost)
🔸 Tight risk with upside if it breaks out above $215
🔸 Good institutional interest & dividend tailwind
🚨 Trigger Alert: Add above $215 for momentum confirmation
🔔 Monitor closely for follow-through above resistance
DISCLAIMER : The content and materials featured are for your information and education only and are not attended to address your particular personal requirements. The information does not constitute financial advice or recommendation and should not be considered as such. Risk Management is Your Shield! Always prioritise risk management. It’s your best defence against losses.

Mara Holdings, Inc. —122 2025 New All-Time HighUltra-bullish with new all-time high in sight, MARA hit the lowest price in April 2025 since November 2023.
Good evening my fellow reader, are you a stock trader?
MARA is preparing for a major rise and this opens up an easy trade. A LONG trade.
Needless to say, a "cryptocurrency mining company" is bullish as the Cryptocurrency market turns bullish. No bull market since 2021 and the chart is perfect for a new all-time high.
The previous bull market lasted 602 days and produced 23,593.92% total growth. This time the growth won't be the same, there is nothing like the first bull market, but it will still be very strong. It is likely that the MARA stock will hit all three targets on this chart (49, 73 and 97) and go beyond.
A new all-time high can be 97 followed by 122. I think these levels can be hit easily as part of the bull market bull run. Months and months of continued growth will produce so much bullish momentum that prices will go off the chart.
Namaste.

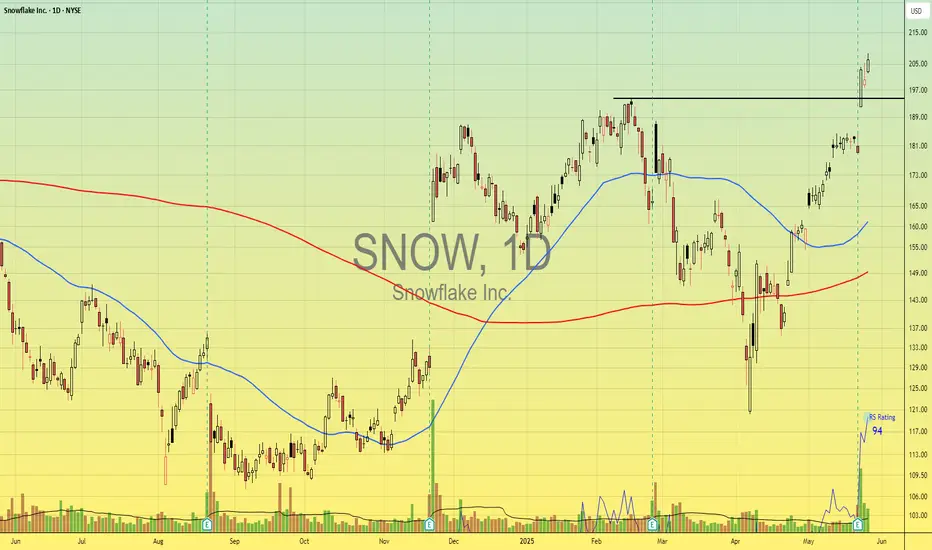
Super performance candidate NYSE:SNOW , cloud-based data platform leader in its fast growing industry as its business model is expected to grow significantly, with strong customer growth and integrating with the A.I rush, positioning itself to capture significant market share.
Sitting at a RS Rating of 94,
I have reasons to believe this security could increase
Zomato complete its whole elliot wave does another coming??????Zomato complete its whole Elliot wave move now its making another or its a time for some rest ??????


Brainbees Solutions Ltd view for Intraday 28th May #FIRSTCRY RBrainbees Solutions Ltd view for Intraday 28th May #FIRSTCRY
Resistance 360 Watching above 361 for upside momentum.
Support area 350 Below 355 ignoring upside momentum for intraday
Watching below 348 for downside movement...
Above 355 ignoring downside move for intraday
Charts for Educational purposes only.
Please follow strict stop loss and risk reward if you follow the level.
Thanks,
V Trade Point

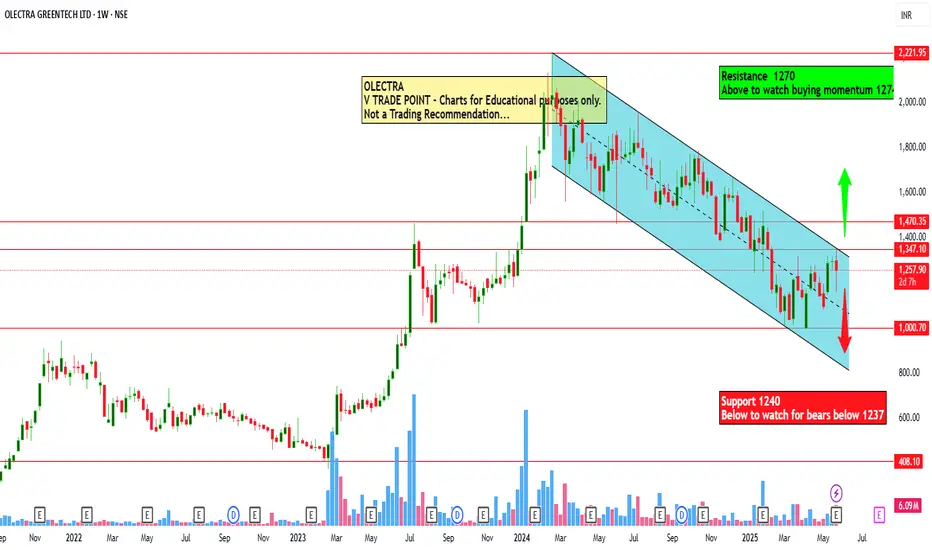
Olectra Greetech Ltd view for Intraday 28th May #OLECTRA Olectra Greetech Ltd view for Intraday 28th May #OLECTRA
Resistance 1270 Watching above 1274 for upside momentum.
Support area 1240 Below 1300 ignoring upside momentum for intraday
Watching below 1237 for downside movement...
Above 1260 ignoring downside move for intraday
Charts for Educational purposes only.
Please follow strict stop loss and risk reward if you follow the level.
Thanks,
V Trade Point
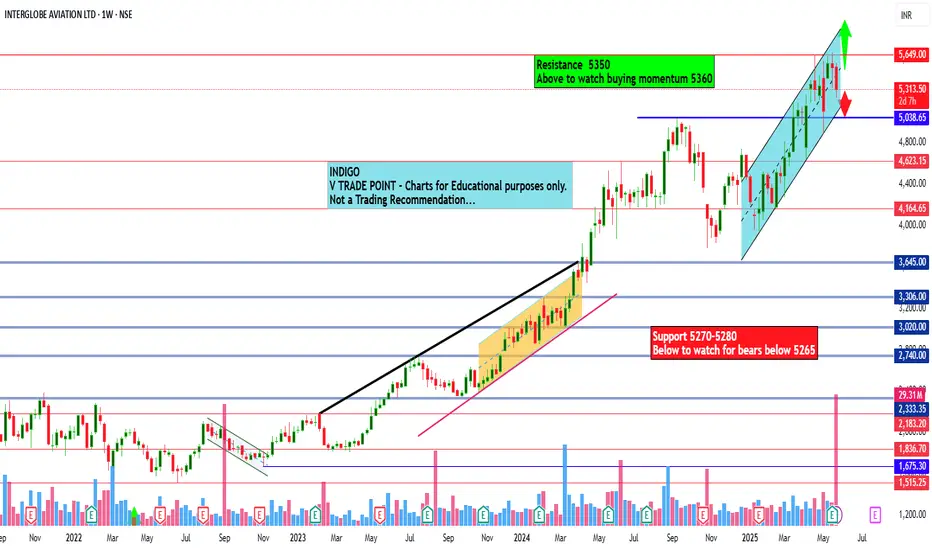
Interglobe Aviation Ltd view for Intraday 28th May #INDIGO Interglobe Aviation Ltd view for Intraday 28th May #INDIGO
Resistance 5350 Watching above 5360 for upside momentum.
Support area 5270-5280 Below 5300 ignoring upside momentum for intraday
Watching below 5265 for downside movement...
Above 5300-5310 ignoring downside move for intraday
Charts for Educational purposes only.
Please follow strict stop loss and risk reward if you follow the level.
Thanks,
V Trade Point
Indian Rail Tour Corp Ltd view for Intraday 28th May #IRCTC Indian Rail Tour Corp Ltd view for Intraday 28th May #IRCTC
Resistance 800 Watching above 802 for upside momentum.
Support area 780 Below 790 ignoring upside momentum for intraday
Watching below 778 for downside movement...
Above 790 ignoring downside move for intraday
Charts for Educational purposes only.
Please follow strict stop loss and risk reward if you follow the level.
Thanks,
V Trade Point

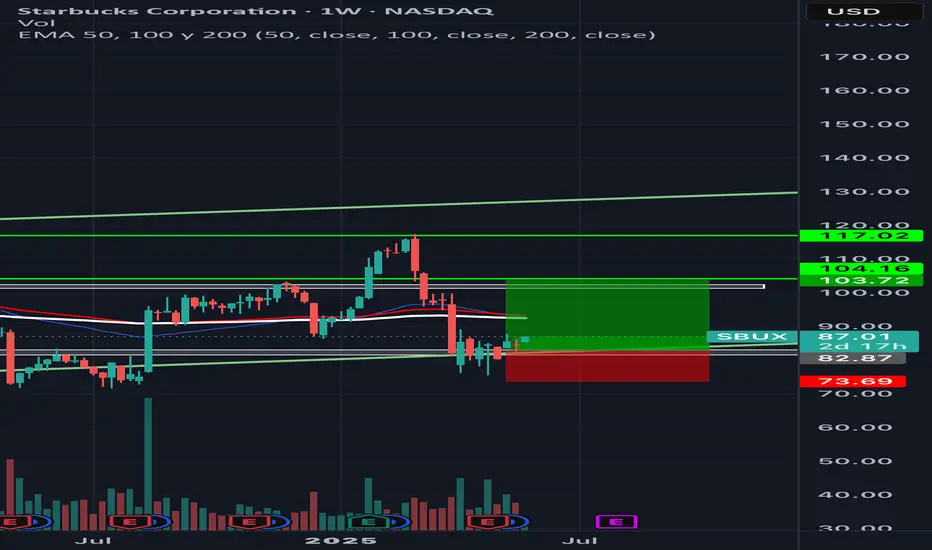
Sbux to $100Sbux sitting in a strong support level. I believe it will come back up $100 in the next month or two. I am not an expert just sharing my thoughts.
I did open some long term call options . Exp: 3/2026.
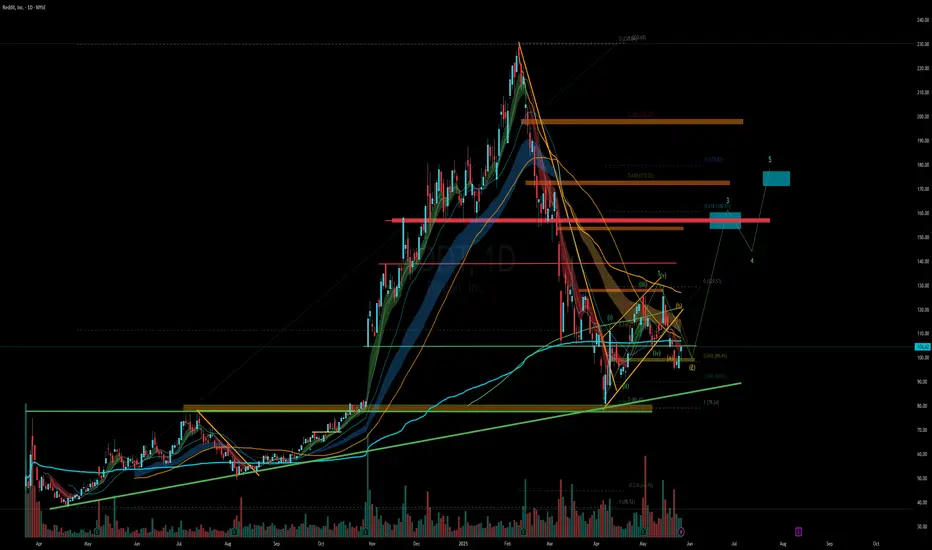
RDDT - Ready for Round 2?RDDT is setting up a base here, let's see if it holds this previous support level around 80.
Target 1 - 160
Target 2 - 180
Stop loss - 75
PARA // Even though there are interruptions in the weekly time period, the prices are above the 03 03 2025 line 50 exponential average. Let's wait for the 22 exponential average to cut upwards from the 50 exponential average.

GAMUDA CONT MARK UPThis is a continuation of my prev post
**Refer link below
In Wyckoff Methode , The Formation of BUEC is a sign that further price advancement will continue
to the phase E (Marking up outside the Trading Range)
The BUEC in this formation, coincide with a Local Spring
On Top of that, with a Feather's weight & Springboard in it
With a Trigger Bar today, position initiated as attached
PureWyckoff

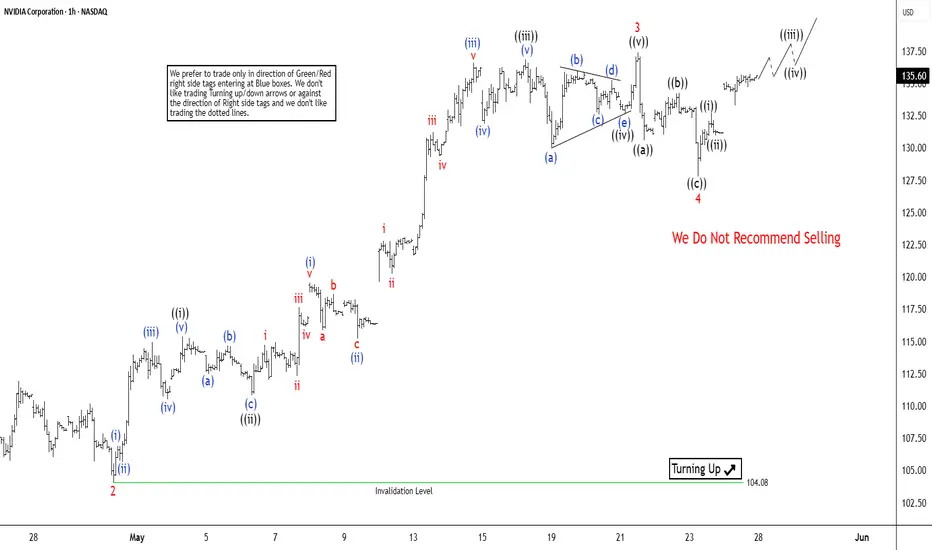
Nvidia (NVDA) Elliott Wave Analysis: Wave 5 Nearing Its EndThe short-term Elliott Wave analysis for NVIDIA (NVDA) indicates a bullish trend unfolding as an impulse structure since the low on April 21, 2025. From that low, the stock completed wave 1 at $111.92. The stock then followed by a corrective pullback in wave 2, which bottomed at $104.08. The subsequent rally in wave 3 displayed strong momentum, characterized by a nested impulse structure in a lesser degree. Within wave 3, the first sub-wave, wave ((i)), peaked at $115.40, with a brief dip in wave ((ii)) to $110.82. The powerful wave ((iii)) surged to $136.89, followed by a shallow pullback in wave ((iv)) to $132.65. The final leg, wave ((v)), concluded at $137.40, completing wave 3 on a higher degree.
The corrective wave 4 unfolded as a zigzag pattern. From the wave 3 peak, wave ((a)) declined to $130.59, wave ((b)) rebounded to $134.23, and wave ((c)) completed the pullback at $127.80, finalizing wave 4. NVIDIA has since resumed its upward trajectory in wave 5. As long as the pivot low at $104.08 holds, the stock is expected to extend higher in wave 5, completing the cycle from the April 21 low. Following this, a larger-degree three-wave pullback is anticipated, offering a potential pause in the bullish trend.
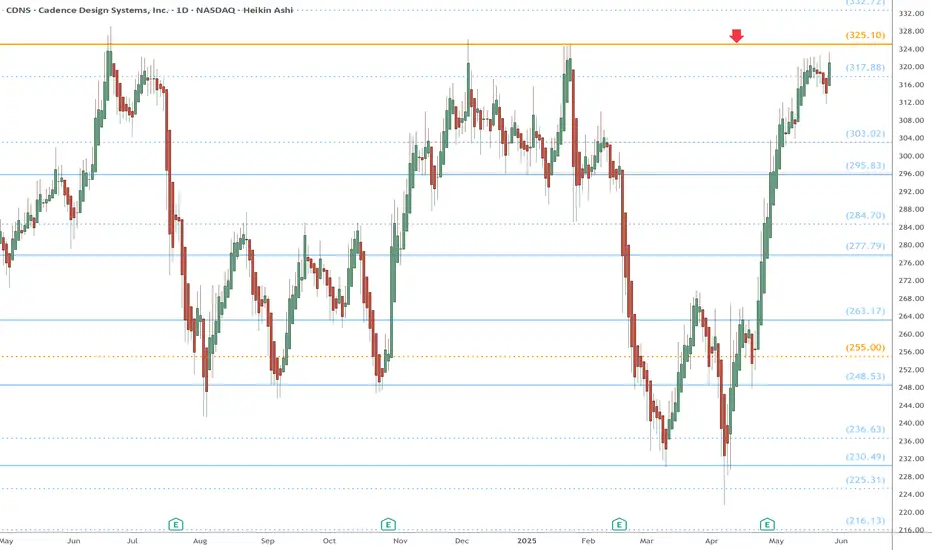
CDNS watch $325.10: Golden Genesis Fib ceiling for over 2 yearsCDNS has topped here many times over the last 2 years.
Golden Genesis fibs are massive landmarks for any asset.
This one has marked THE TOP for over 2 years thus far.
It is PROBABLE that we "Orbit" this a few times.
It is POSSIBLE that we reject for another top.
It is PLAUSIBLE to Break and run to new ATH.
=================================================
.
ALNT Long Trade Setup – Reversal Breakout Play!!✅ Trade Type: Long
🕒 Timeframe: 30-Minute
🎯 Entry Zone:
$31.05 (Breakout candle near trendline resistance)
🔻 Stop-Loss (SL):
$30.11
Placed below recent support and demand zone
🎯 Target Zones:
TP1: $32.07 (Red line – minor resistance zone)
TP2: $33.56 (Green line – previous top / range high)
📊 Risk-Reward Ratio:
Approx. 1:2.5+ – solid upside if breakout holds
🔍 Chart Analysis Notes:
Descending wedge breakout + higher low confirmation
Breakout from compression zone with bullish bias
Price reclaiming yellow resistance zone (now potential support)
Trendline breakout is confirmed with price closing above
📌 Pro Tips:
Watch for strong push above $32.07 for TP2 confirmation.
Trailing SL using ATR 1.26 is smart as trend continues.
Look for volume to rise to validate breakout.

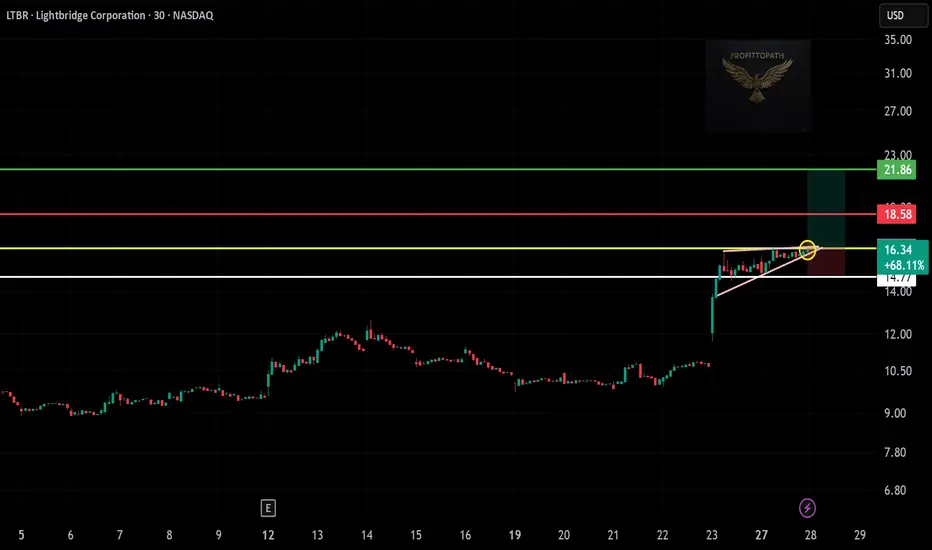
LTBR Long Trade Setup – Eyeing the Breakout!🚀
✅ Trade Type: Long
🕒 Timeframe: 30-Minute
🎯 Entry Zone:
$16.34 (Current breakout level after consolidation)
🔻 Stop-Loss (SL):
$14.77
Smartly placed below the recent support and ascending triangle base
🎯 Target Zones:
TP1: $18.58 (Red line – intermediate resistance)
TP2: $21.86 (Green line – extended move target / supply zone)
📊 Risk-Reward Ratio:
Strong R:R (≈ 1:2.5 or more)
🔍 Chart Analysis Notes:
Ascending triangle pattern with a tight consolidation near resistance
Strong bullish move prior to consolidation indicates buyer control
Volume is healthy; price respecting trendline
Yellow zone is likely a prior resistance flip or decision level
📌 Pro Tips:
Watch volume spike confirmation on breakout above $16.50-$16.70.
Trailing stop using ATR 1.23 is a smart way to lock in profits.
Take partial profit near $18.58, especially if momentum weakens.