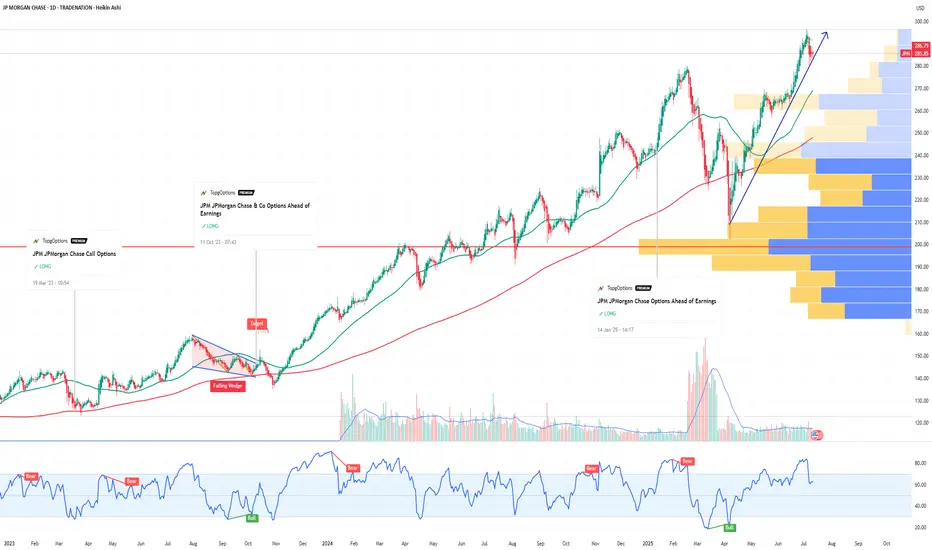
JPM JPMorgan Chase & Co Options Ahead of EarningsIf you haven`t bought JPM befor the rally:
Now analyzing the options chain and the chart patterns of JPM JPMorgan Chase & Co prior to the earnings report this week,
I would consider purchasing the 290usd strike price Calls with
an expiration date of 2026-1-16,
for a premium of approximately $20.20.
If these options prove to be profitable prior to the earnings release, I would sell at least half of them.
Disclosure: I am part of Trade Nation's Influencer program and receive a monthly fee for using their TradingView charts in my analysis.
MSTR stock has seen a strong rally since JuneSince June, MSTR stock has seen a strong rally—rising from the mid‑$300s to above $430—driven by a few key factors:
Bitcoin’s continued ascent has fueled sentiment. Bitcoin recently hit fresh record highs (above $118K), driven by a weakening dollar and bullish macro trends, which in turn boosted bitcoin-linked equities like MicroStrategy.
In short, MSTR’s rally since June has been largely Bitcoin-driven: a powerful combination of rising crypto prices, ongoing BTC purchases, proactive capital raises, and positive analyst sentiment creating a bullish feedback loop.
Let me know if you'd like a breakdown of Bitcoin’s trend or deeper insight on MSTR’s financing strategy.
$447 will be my next buy TP.
Please, share your thought, like, share and follow me.

NVO: Trend Continuation With 4.74 R/R SetupNovo Nordisk ( NYSE:NVO ) is showing classic strength — bouncing off the cloud, reclaiming structure, and flashing early signs of momentum rotation. This is how you catch continuation trades without chasing.
📊 Technical Breakdown
Ichimoku: Price reclaimed the top of the cloud and is now building above it. Kijun and Tenkan are aligned. This is the first real bullish structure since the March breakdown.
MACD: Histogram curling upward. We’re not fully bullish yet, but the pressure is shifting back to buyers.
R1 Pivot ($81.31) is the first big test. A clean break above that opens the path toward R2 and beyond.
🎯 Trade Specs
Entry: $71.58
Target: $93.33 (+30.44%)
Stop: $67.00 (–6.42%)
Risk/Reward: 4.74 — elite-level skew for a high-quality name

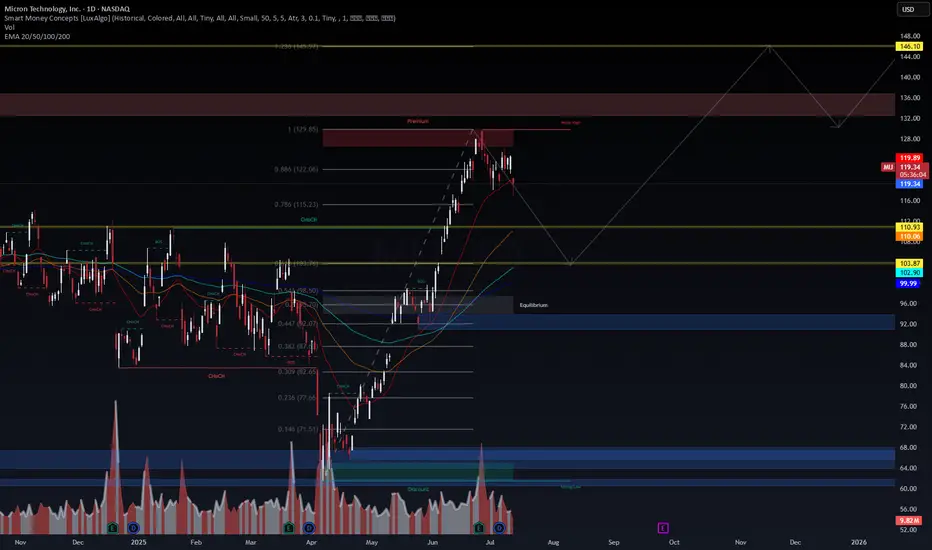
MU - SMC Premium Zone Rejection | Targeting Equilibrium Before E📉 MU - SMC Premium Zone Rejection | Targeting Equilibrium Before Expansion
🔍 WaverVanir DSS Framework | SMC x Fibonacci x Liquidity
We just observed rejection from the Premium zone and 0.886 Fibonacci retracement near $129.85, aligning with prior weak high liquidity. Price has shown signs of distribution, with a likely retracement to the Equilibrium zone ($98–$103) before any bullish continuation.
🧠 Key Observations:
ChoCH confirmed post-run to premium → Expect redistribution
Price rejected 0.886 (122.06) and weak high near 129
Strong EMA confluence forming around 110–103 range
Equilibrium zone and volume spike near $98–$103 offers valid demand
Long-term target remains open toward Fib extension @ $146.10, but only after deeper retrace
📉 Short Bias Until $103–$98 Demand Zone
🔁 Then flip long if bullish confirmation appears
📊 VolanX Market View:
Structure: Breaker → ChoCH → Premium Rejection
Bias: Retracement → Reaccumulation
Tools Used: Smart Money Concepts, Fib, Volume, EMA stack, Liquidity zones
🧠 Built using the WaverVanir DSS, designed to navigate institutional flows and macro-infused setups. We’re tracking this sequence closely across cycles.
📅 Chart Date: July 14, 2025
📍 Asset: NASDAQ:MU (Micron Technology Inc.)
💬 Follow @WaverVanir for macro-aware, alpha-focused setups.
📈 Disclaimer: Not financial advice. Educational content only.
#SMC #OptionsFlow #FibLevels #LiquidityZones #WaverVanir #VolanX #TradingView #MU #Micron #TechStocks #InstitutionalTrading #VolumeProfile #ChoCH #Equilibrium #SmartMoney
2250
On the chart:
Confirmation and failure zones.
After the triangle, the price is targeting a new high as a near-term target.

AMZN Sitting on a Key Launchpad – What’s Next? for July 14🧠 GEX Analysis & Option Strategy:
* Gamma Wall / Resistance: $225
* Next Major Call Walls: $227.5 → $230 → $235
* Call Side Dominance: 13.3% Calls, low IVR at 27.4, IVx avg 38.9
* Put Support: $217.5 / $213.5
* GEX Bias: Mildly bullish bias above $225 — price is floating at Gamma Wall.
🟢 Bullish Option Play:
* Scenario: A breakout above $227.5 could ignite a gamma squeeze to $230–$235.
* Strategy:
* Buy AMZN 230C (7/19 or 7/26 expiry) on breakout above $227.6
* Stop: Break below $224
* Target: $230 → $234
* Lower IV makes calls cheaper; strong momentum + low IV = favorable R/R.
🔴 Bearish Hedge:
* Scenario: Rejection at $227.5 and fall below $224 zone
* Strategy:
* Buy AMZN 220P or 217.5P (7/19 expiry) if price breaks below $224.
* Target: $217 → $213
* Only valid if we break structure below trendline and BOS flips.
📈 1-Hour Chart Technical Outlook (Smart Money Concepts):
* CHoCH → BOS → Retest is confirming bullish structure.
* Price broke out of prior range (purple box around $224–$225).
* Current Setup: Minor pullback to the OB or top of range ($224.5–$225) is underway.
* Structure favors retest long entries unless we break the ascending trendline.
Key Levels:
* Support Zones:
* $224.50 (retest demand/OB)
* $222.26 (ascending trendline + structure confluence)
* Resistance Targets:
* $227.5 → $230 → $232.5 (GEX targets)
📌 Long Setup:
* Entry: $224.6–$225 (on OB retest)
* Stop: $222.25
* Target: $230–$232.5
* Confirmation: Look for bullish candle at the retest zone
⚠️ Bearish Scenario:
* If price fails $224 and breaks structure at $222.25, anticipate reversal into $219.70–$217 zone. Watch price reaction there for potential swing support.
🧭 Thoughts & Summary:
* AMZN has triggered a clean BOS and now consolidates just under a GEX breakout level.
* The next move will likely be decided early in the session — either a strong push through $227.5 → gamma ramp toward $230+, or failure and fade back toward $222–$219.
* Call buyers may find a good breakout play while keeping tight stops under the OB.
Disclaimer: This analysis is for educational purposes only and does not constitute financial advice. Always do your own research and trade responsibly.

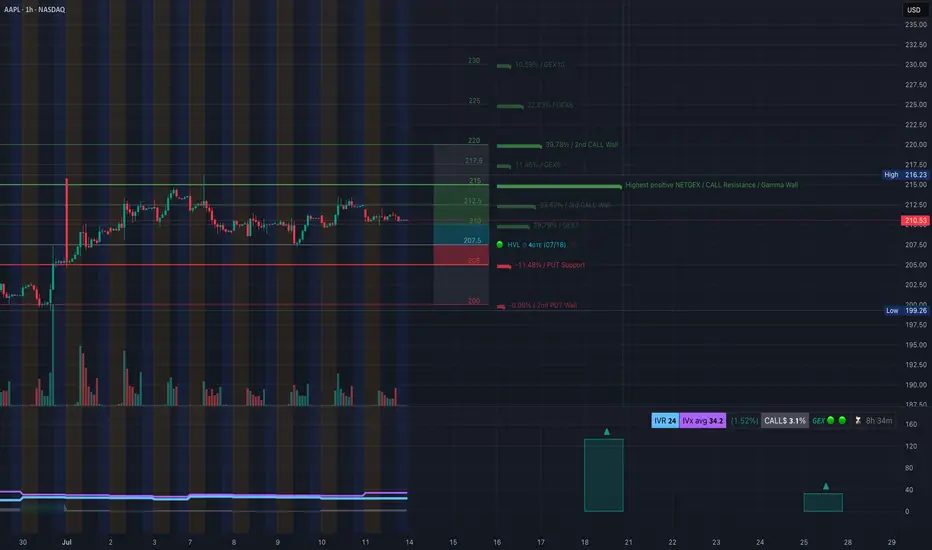
AAPL at a Pivotal Zone! TA for July 14AAPL at a Pivotal Zone! GEX & Price Action Align for Major Move 📉📈
🧠 GEX Sentiment (Options-Based Insight)
* Current Price: $210.53
* GEX Zone Traps:
* Below Price:
* 🟥 Put Support at $205 (-11.48%)
* 🔻 PUT Wall at $200 (-9.06%) — strong floor
* Above Price:
* 🟩 CALL Walls at:
* $212.5 → 29.79% GEX7
* $215 → 38.62% GEX6 (3rd largest resistance)
* $217.5 → 11.45% GEX9
* $220 → 39.78% GEX2 (heavy resistance zone)
* 🟩 Max GEX Cluster: $215–$220
* 🔺GEX10 spike at $230 → unlikely unless squeeze
* IVR/IVX:
* IVR: 24 (low volatility environment)
* IVX: 34.2 → Soft volatility bounce
* Call/Put Flow:
* Calls: 3.1% favored
* GEX trend: 🌕🌕🌕 (Neutral-to-Bullish if over $212.5)
📦 Interpretation:
Gamma compression is strong near $212.5–$215. If AAPL stays above $210.5 and reclaims $212.5, options market opens up space toward $217.5–$220. Below $207.5 = risk of drop toward $205 then $200 PUT wall.
🕹️ Option Trade Ideas Based on GEX
Bullish Strategy (IF Breaks $212.5):
* Trade: Buy AAPL 215c or 217.5c (Jul 19 or 26 expiry)
* Trigger: Hold above $212.5
* Target: $217.5–$220
* Stop: Break below $209.8
Bearish Strategy (IF Breaks $207.5):
* Trade: Buy AAPL 205p or 200p (Jul 19 or 26 expiry)
* Trigger: Loss of $207.5 with momentum
* Target: $205 → $200
* Stop: Reclaim of $210.5
🔍 1-Hour Chart Analysis (Price Action)
* Structure: Sideways consolidation between $207.5–$213.5
* Key Levels:
* Demand: $205–$207.5 (Buyers defended)
* CHoCH (Change of Character) confirmed near $209.8
* Resistance: $213.48 (rejected multiple times)
* Trendline: Rising wedge forming under liquidity sweep zone
* Liquidity Pools: Resting above $215 and below $205
* FVG/OB Zones: Thin FVG at $209.8–210.5 and mid OB around $207
📈 Scenario 1 (Bullish):
* If price bounces off $210 again and breaks $212.5 with volume, watch for sweep of $215–$217.5
* Watch for re-entry above CHoCH/BOS confluence near $211.5
📉 Scenario 2 (Bearish):
* If we break $207.5 and fail to reclaim $210.5 → liquidity vacuum opens toward $205 and $200
✅ My Thoughts & Suggestions
* Direction Bias: Neutral > Bullish if $212.5 is claimed, otherwise range-bound.
* Best Risk/Reward: Wait for $212.5 breakout confirmation OR $207.5 breakdown.
* Scalpers: Use $210.5–212.5 as chop zone — fade edges.
* Swing Traders: Only enter on clear breakouts with stop discipline.
🔒 Disclaimer:
This analysis is for educational purposes only and does not constitute financial advice. Always do your own research and manage your risk before trading.
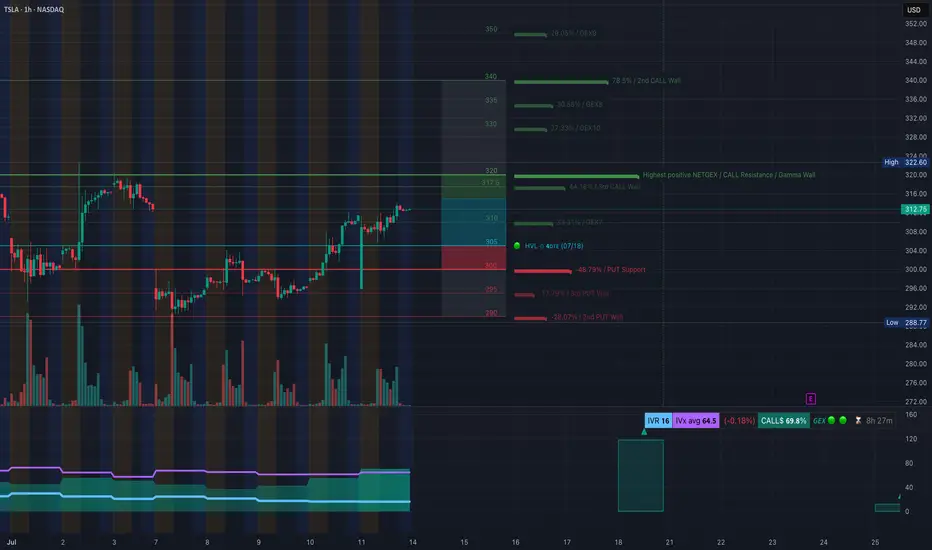
TSLA TA – Call Side Dominance Nearing Resistance-July 14TSLA GEX Analysis – “Call Side Dominance Nearing Critical Resistance 💥”
GEX Snapshot:
* Highest Positive GEX / Resistance: $320 – This is where call positioning is heaviest and likely where dealer hedging could resist further upside.
* Call Walls:
* $317.5 (44.18%)
* $320 (High NetGEX)
* $335–$340 (Intermediate resistance, weaker positioning beyond)
* Put Walls:
* $300 (48.79% support)
* $295 / $290 (3rd/2nd tier walls)
Options Oscillator:
* IV Rank (IVR): 16 (Low)
* IVx avg: 64.5
* Call Positioning: 69.8% (very bullish skew)
* GEX: 🔰 Bullish
🎯 Options Trade Setup:
Direction: Cautiously Bullish – but close to key resistance!
⚡ Aggressive Bullish Setup:
* Entry: Near $312.75 (current price)
* Strike: Buy $317.5C or $320C expiring this week
* Target: $320+
* Stop: Close below $308
* Note: Watch dealer hedging around $320. If TSLA breaks $320 with strength, gamma squeeze toward $335 is possible.
🛡️ Bearish Reversal Setup (if rejected at $320):
* Strike: Buy $310P or $305P (next week expiry)
* Trigger: Rejection at $320 + breakdown below $311
* Target: $304–$300
* Stop: Above $321
📉 TSLA 1-Hour Chart Analysis – “Breakout Zone or Fakeout Trap? Watch These Levels 🎯”
Structure:
* TSLA broke above the CHoCH and BOS zones between $308–$310. Price is consolidating under the $317.5–$320 resistance (also seen on GEX).
* There’s a clean ascending wedge/channel forming – upper boundary is near $320, and the lower trendline is near $304.
Key Zones:
* Supply Zone (Purple): $317.5–$320 (watch for rejection or breakout)
* Support: $309.8 (BOS zone), then $304 (trendline + demand overlap)
* Demand Zone: $293.5–$296 (origin of last rally)
🛠️ Trade Scenarios:
🔼 Bullish Continuation:
* Entry: Break and hold above $320
* TP1: $325
* TP2: $335
* SL: Below $311
🔽 Bearish Pullback:
* Entry: Rejection at $317.5–$320 zone and break below $309
* TP1: $304
* TP2: $296
* SL: Above $320
✅ Summary:
* GEX favors calls but $320 is a critical gamma wall – if broken, it opens room toward $335+.
* On the chart, watch the rising channel and upper resistance at $320.
* Bullish momentum is still intact unless $309 fails.
* Stay nimble: scalp calls on breakout, or prepare for a reversal put if there's rejection and structure break.
Disclaimer: This analysis is for educational purposes only and not financial advice. Trade at your own risk with proper risk management.
NFLX Price ActionNASDAQ:NFLX showing strong bearish momentum on the 1H. If it breaks below the key $1230 level, next support sits near $1215 — watch for continuation flush 👀🔥


Correlation between 2021 squeeze and 2024-2025 price actionRefer to my 2021 squeeze post idea, you can see a very similar pattern, I predict 30s mid august followed by another dip. MOASS? Probably not but maybe assuming crime has run out of tricks

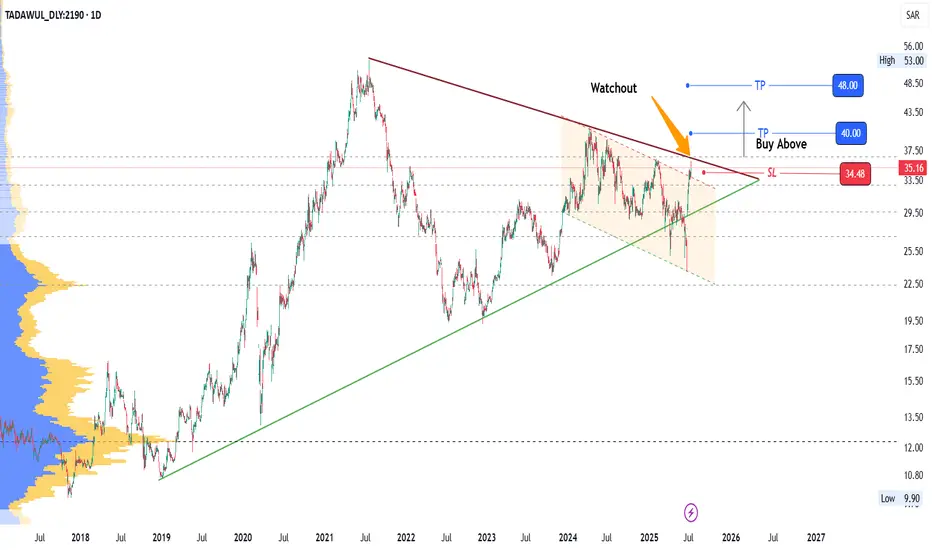
2190: Watch for Breakout2190 has reached Triangle Top (Trendline resistance) breaching a descending parallel channel resistance recently.
Watchout for the breakout of resistance.
Levels are marked.
Manage your risk with proper SL.
Enjoy the ride!
UNH bear flag and gapsUNH has been top of my radar for a bullish reversal. With 2 major gaps to fill after the epic collapse in share price this ticker has a lot of potential. Currently sitting in what appears to be a bear flag, it is holding above the monthly 200EMA (overlayed on this 4H chart). However price recently rejected off the daily 21ema (overlayed on this 4H chart) and if the bear flag is any indicator price may head lower for another liquidity sweep before the inevitable bullish reversal.
A side note: insiders have been buying $millions since the share price collapsed which is always a good indicator of what's to come.

NIO – Breakout Approaching from Apexhi Traders
How are you today? Do you like NIO stock today?
The price of NIO is currently sitting right at the apex of a narrowing wedge, indicating that a decisive breakout is likely imminent. This technical formation has been building for months, and the price has now tightened into a point where volatility and direction are expected to return soon.
The RSI (Relative Strength Index) is showing bullish signs, with an upsloping structure despite the sideways price action, which suggests growing bullish momentum under the surface. This hidden strength adds confidence to a potential bullish breakout.
We’ve identified two key upside targets for the bulls:
🎯 Target 1: $5.24 — a 45% move from current levels
🎯 Target 2: $7.70 — previous resistance and a major psychological level
However, on the flip side, if the price breaks down from this pattern instead of up, we could see NIO revisit levels as low as $2.20, which would delay the bullish scenario significantly and potentially extend the consolidation phase.
Summary:
🔺 At apex of wedge pattern — breakout expected soon
📈 RSI is bullish and rising, indicating potential strength
🎯 Bullish targets: $5.24 and $7.70
⚠️ Bearish breakdown risk: Downside to $2.20
Traders should watch for a confirmed breakout or breakdown before entering, as momentum can accelerate quickly once direction is established.

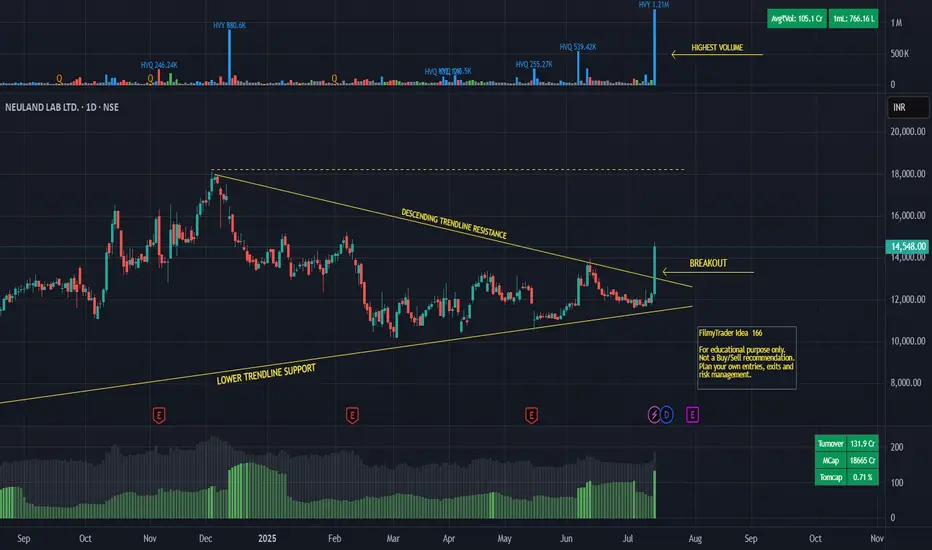
Neuland Lab - Trendline BreakoutNEULAND LABORATORIES LTD.
Breakout from trendline resistance on daily timeframe.
Breakout with heavy volume.
Close crossing last week high.
Increasing relative strength.
Disclaimer:
For educational purpose only.
Please do your own research before taking any trades.
Happy Trading!
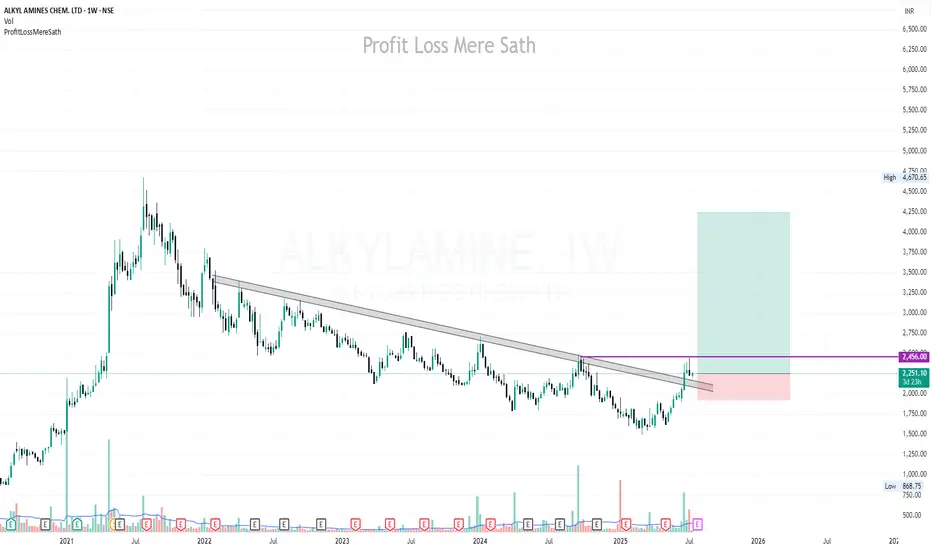
ALKYLAMINE | Buy @LTP | SL below 1900 | Targets 2700, 3440, 4250Disclaimer:
This is not financial advice. Please do your own research or consult with a financial advisor before making any investment decisions. Investments in stocks can be risky and may result in loss of capital.
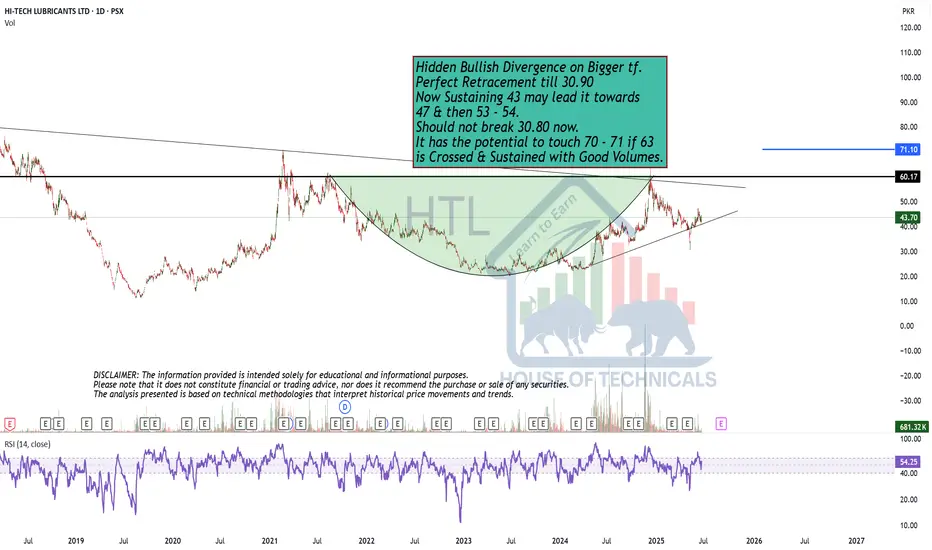
Perfect Retracement till 30.90Hidden Bullish Divergence on Bigger tf.
Perfect Retracement till 30.90
Now Sustaining 43 may lead it towards
47 & then 53 - 54.
Should not break 30.80 now.
It has the potential to touch 70 - 71 if 63
is Crossed & Sustained with Good Volumes.
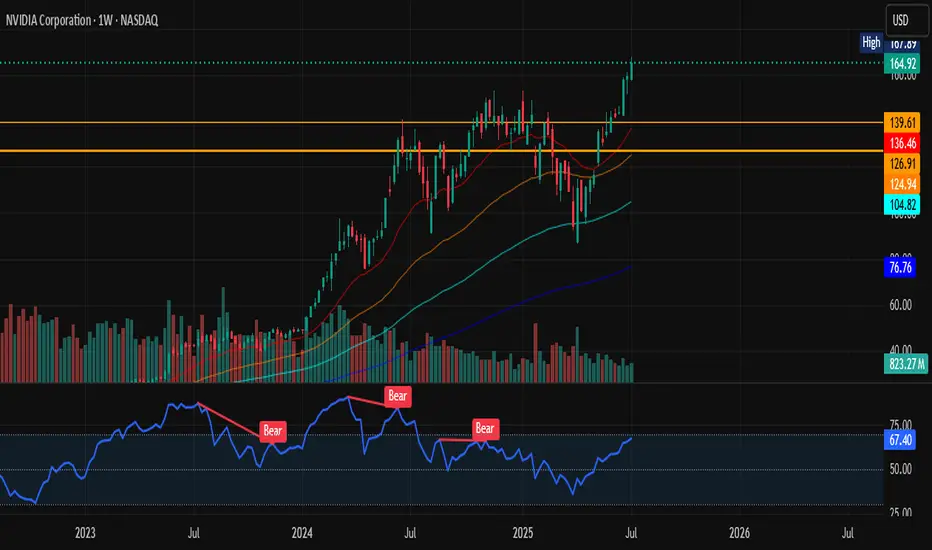
NVIDIA Technical Breakdown NASDAQ:NVDA has broken above the previous congestion/resistance zone (~$139–$145). This zone was tested multiple times and now acts as a support base.
Volume on the breakout week is strong and supporting the move.
Weekly RSI is 67.40, approaching overbought but NOT YET overheated (no bearish divergence). RSI broke past prior Bear zones, signaling renewed strength. Only time will tell.
All-time high territory so proceed with caution. Always due YOUR OWN research.
Bullish long-term trend intact as price is above all EMAs (not too shabby).
I wouldn't be surprised for a pull back soon; maybe 145ish.
Happy Sunday ya'll!
**As always: this isn't financial advice. Please seek professionals on any investments.
NVDA Daily Chart – Rising Wedge Alert!Just analyzed this NVDA setup. We’re seeing a clear rising wedge forming near the top of a strong run-up — typically a bearish reversal pattern. Price tagged $167.89 and pulled back slightly, closing at $164.92.
If this breaks down, watch the $148.67 - 151.31 area, and below that $125 as a key level. Bulls want to see a strong hold and breakout above $168 to invalidate the wedge.
#NVDA #NVIDIA

MP Materials Options Ahead of EarningsIf you haven`t bought MP before the previuos earnings:
Now analyzing the options chain and the chart patterns of MP Materials prior to the earnings report this week,
I would consider purchasing the 25usd strike price Calls with
an expiration date of 2025-6-20,
for a premium of approximately $2.97.
If these options prove to be profitable prior to the earnings release, I would sell at least half of them.

Short-term Bear Case for CRCLHello Traders!
As part of my weekly equity trade analysis, I will be uploading my recordings of what I am seeing and intending to trade for the week. A quick summary of what's in the video is as follows:
- CRCL is a high beta stock that seems to not be moving in tandem with its peers as of late
- I am expecting volatility due to market data and monthly options expiration
- CRCL has formed a new bearish order block below another bearish order block and is wedged with a weekly bearish setup. We are anticipating expansion out of this range to the downside
- I am waiting for a re-test of $199-$205 for a full move to $155-$145
Cheers,
DTD

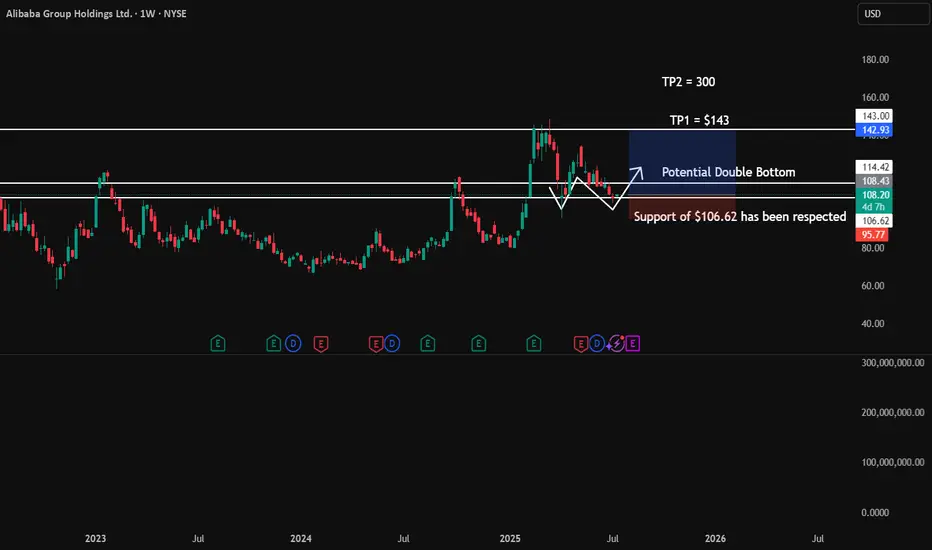
BABA longPotential double bottom to be formed on the Weekly TF.
I think well into Aug and Sept, this will mature.
$143 is a key price value zone.
$MSTR: Long term bullish trendNASDAQ:MSTR long term signal triggered...
Up trend in monthly scale until end of 2025.
Heard it here first, lads.
Best of luck!
Cheers,
Ivan Labrie.
