TATA MOTOR - LONGNSE:TATAMOTORS Weekly rounding bottom at location with accumulation formation of inv head and shoulder.

ADANI Power: From Buy to Sell and from Sell to BuyADANI Power: From Buy to Sell and from Sell to Buy. What a strange movement .
610 is a first resistance level to test.
( Not a Buy / Sell Recommendation
Do your own due diligence ,Market is subject to risks, This is my own view and for learning only .)

Reversal !Reversal after a long down run, nifty IT also bullish. Lets see how it will perform. It should do well! based on my study. Guys what do you think?

Transrail Lighting daily chartTransrail Lighting looks gaining momentum I am looking for quick 10%. If breaks above the channel and sustains, then it can hit Rs1000+.
Not a buy-sell recommendation, do your own diligence or consult your financial advisor.

Waiting RIVN is still resting at a major support level above the 50 EMA and in the Fibonacci golden zone. RSI is still above 50; momentum is still leaning bullish.Volume is drying up and is low, and the price hasn’t moved yet. We’re waiting for a breakout or breakdown. SAR indicator, alludes to just a minor pullback and that uptrend is still intact. The next move could possibly be the big one or not.

#MPHASIS - 2309 OR 2746.60?Date: 27-05-2025
#MPHASIS Current Price: 2537.8
Mid-Point: 2527.80
,
#MPHASIS Upside Levels: 2671.01, 2746.60, 2828.65 and 2910.70
#MPHASIS Downside Levels: 2384.87, 2309.00, 2226.95 and 2144.90
Support: 2460.73
Resistance: 2595.41
#MPHASISChartAnalysis
#MPHASISChartPatterns

GRAB 1W: Two Years of Silence — One Loud BreakoutGRAB 1W: When stocks go quiet for two years just to slap bears across both cheeks
The weekly chart of GRAB shows a textbook long-term accumulation. After spending nearly two years in a range between $2.88 and $4.64, the price is finally compressing into a symmetrical triangle. We’ve already seen a breakout of the descending trendline, a bullish retest, and the golden cross between MA50 and MA200. Volume is rising, and the visible profile shows clear demand with little resistance overhead.
The $4.31–$4.64 zone is key. Holding this level opens the path to $5.73 (1.0 Fibo), $6.51 (1.272), and $7.50 (1.618). The structure is clean, momentum is building, and this accumulation doesn’t smell like retail — it smells institutional.
Fundamentally, GRAB is a leading Southeast Asian tech platform combining ride-hailing, delivery, fintech, and financial services. Yes, it’s still unprofitable (–$485M net loss in 2024), but revenue is growing fast, recently crossing $2.3B. Adjusted EBITDA has been improving steadily, and the company holds $5.5B in cash equivalents with minimal debt — giving it excellent liquidity and expansion flexibility.
Valued at ~$18B, GRAB operates in the world’s fastest-growing digital market, with increasing institutional exposure from players like SoftBank and BlackRock. The 2-year base hints at smart money preparing for the next big move.
Tactical plan:
— Entry: by market
— Targets: $5.73 → $6.51 → $7.50
— Stop: below $4.00 or trendline
If a stock sleeps for 2 years and forms a golden cross — it’s not snoring, it’s preparing for liftoff. The only thing left? Don’t blink when it moves.

should go to 2300 after retesting the breakoutNow the stock is retesting the breakout area out of cup and handle, if this turns out to be true, the next target should be 2300.

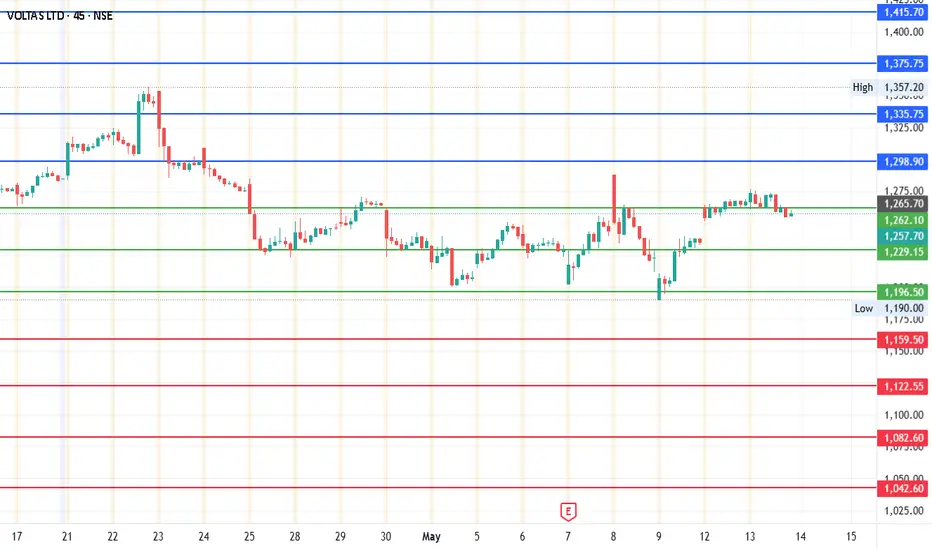
Voltas - Short TermCurrent Price: 1257.7
Mid-point: 1229.15
Upside Targets: 1298.91, 1335.75, 1375.73 and 1415.70
Downside Targets: 1159.52, 1122.55, 1082.58 and 1042.60
Support: 1196.49
Resistance: 1262.08
#Voltas
#VoltasChartPatterns
V-Bottom + Apocalypse news => Going UpV bottom was formed.
News are clearly bearish in a conclusive way =>> fool the public to sell shares to the big fish while the market will go up...
Overall market sentiment under the hood is bullish. Public is in huge fear of banks that collapsed and will continue to collapse, so the masses will sell stocks on an up wave fearing it will go down.
How else you will make the mass public sell their stocks? if there is no apocalypse on the way...? think about it...

Possible Long ???It has broke the triangle pattern and trying to move higher, possibility to reach new higher highs.

Verizon is ready to pop!This stock rallies when 10-year yields fall. Especially if tech stocks take a breather. Tech stocks are on average well into over-bought territory, and 10-year yields have been falling precipitously. Verizon is highly stable and provides a massive dividend which investors flock to when yields fall, currently sitting at about 50% higher than 10 year treasury notes.
Combine that with all of the technical indications like the multi-week consolidation inside a bull flag has primed VZ to break out, and you have a great setup.
A liquidity sweep has taken place, and it appears the next target for the stock is around $47.50, in-line with most analyst estimates.
Call options on July 18 strikes have very high OI. As price moves through these strikes, a rally could ensue. Prior rallies average 10-20%, and typically the stock rallies prior to the Ex Dividend date, which is on July 10th. The stars appear to be aligning on this one.

RELIANCE INDUSTRIES at Key Zone !!This is the 1 hour Chart of RELIANCE INDUSTRIES.
Stock has formed a large Broadening Wedge pattern, with a projected target around the 1560 range.
Stock has formed a ascending triangle patterrn with a projected target around the 1560 range.
stock has given a breakout at 1460 range. If it successfully retests and holds this level as support , then we may see higher prices in RELIANCE INDUSTRIES.
Thank you !!

Applied Digital Preparing For Lift OffAPLD is looking great, it fell right into my pull back zone and looks like it will run again. I bought $4.50, but sold after bagging 200%. I have been patiently waiting for the next opportunity and I think this is it. I think we have a nice bull flag here that will lead us back up. Not financial advice. DYOR

$SMCIVERY BULLSIH HERE,
Consolidation for a long period now.
Support on trend is necessary and then boom

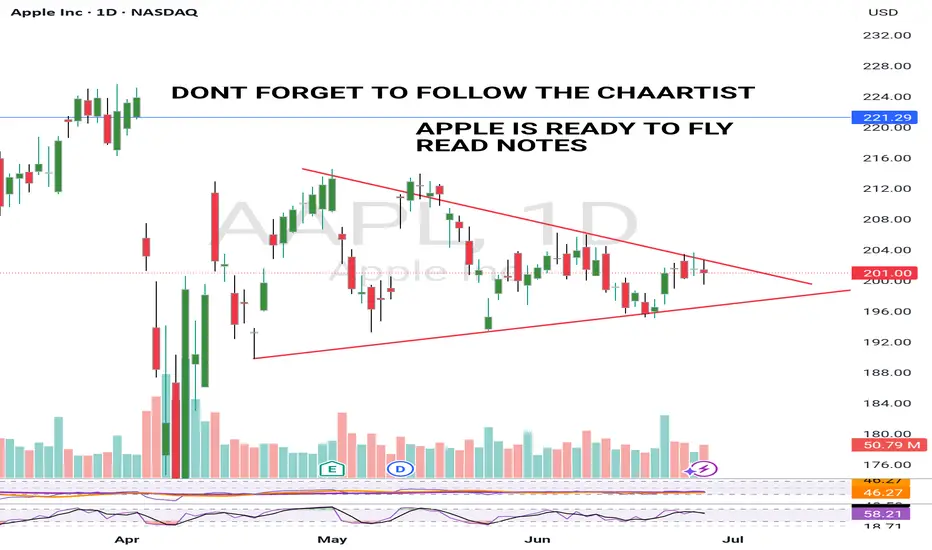
APPLE BULLISH 26 JUNE 2025Apple looks ready to breakout.It is really well squeezed now and ready to form a Green candle.
Breakout is an expectation so dont trade blindly.
I will upload video analysis Asap.
I am bullish and my price target is a minimum $220 from here.
NOTE: RISK MANAGEMENT IS A MUST
$AMZN - $2128.20 break for move higher. Multiple catalystAMZN - Stock rejecting daily highs at $218.20 and rejecting it trice. Long and swing calls added in the group. July has been a good month for the stock. Prime day coming in the next 2 weeks. looking for more calls above $220 for a move towards $240 and higher

$META - channel breakout and test of all time highs incomingMETA - Stock breaking out of the channel on the daily time frame. Stock is approaching all time highs at $739.68. We might see a possible retest those levels very soon. calls above $727 looking good.

JIOFIN - The real test.As always, the chart is self-explanatory.
- The price is at a dual resistance point: previous support turned resistance and trendline resistance.
- Crossing this point will be crucial if the price needs to maintain its upward momentum.
Do you think Jio can do it in the first go?
Disclaimer: The information provided in this post is for educational and informational purposes only and should not be considered as financial advice. I am not a licensed financial advisor, and this content is based on my personal analysis and opinions. Trading stocks involves significant risk, and you should conduct your own research or consult with a qualified financial advisor before making any investment decisions. Past performance is not indicative of future results. I am not responsible for any financial losses or gains you may incur as a result of using the information provided herein.

DLTR: Range + Flow SetupDLTR – Trading Within Range Amid Strategic Evolution & Flow Anomalies
Dollar Tree (DLTR) continues to show strength post–Q1 FY2025 earnings, breaking higher as it pushes through its multi-price format transition and nears the Family Dollar divestiture. The stock is outperforming key peers (DG, TJX, COST) and trading above both the 50- and 200-day MAs — a signal of growing institutional confidence.
On the fundamentals: Net sales (ex-Family Dollar) jumped 11.3% to $4.64B, comps grew 5.4%, and gross margin expanded to 35.6% despite transitional headwinds. Full-year EPS was guided up to $5.15–$5.65, reflecting management’s conviction in sustained growth. Analysts responded by revising EPS to $6.12 (+13.5% YoY), validating the turnaround thesis.
Valuation-wise, DLTR remains notably underpriced. It’s trading at 16.66x forward earnings — well below the retail average and far cheaper than peers like COST (51.1x), TJX (26.9x), and DG (19.0x). The gap is especially compelling given DLTR’s momentum and shift toward higher-margin discretionary sales via the “3.0” format.
Unusual Activity Insight:
What caught my attention was a cluster of unusual options activity suggesting a short-term strangle strategy centered around the July 18 expiration — likely positioning for the stock to stay range-bound while capturing premium from elevated IV post-earnings. The structure and OI shifts imply smart money is playing both ends of the current price band.
Trading Range and Setup:
DLTR has been respecting a range between $92 and $102, consolidating after its post-earnings move. That behavior, combined with the flow signals, sets the stage perfectly for a defined-risk premium play.
My Approach: Iron Condor (July 18 Expiration)
- Sell 100 Call / Buy 105 Call
- Sell 95 Put / Buy 90 Put
This iron condor aligns with the projected range, offering attractive premium while keeping defined exposure. With theta working in our favor and volatility elevated, it’s a setup that thrives in quiet bullish chop — exactly what we’ve seen since the Q1 breakout

BNTX Long Trade Setup!📈 🚀
Price breaking trendline resistance—bullish momentum building 📊
Entry: $106.00 ✅ | Stop: $104.92 🛑
Target: $109.97 🎯 — watching for clean breakout 🔼
#BNTX #LongTrade #TechnicalAnalysis #TradingView #StockMarket

SLB Long Trade Setup!📈 🔥
Recovering from sharp drop — trendline breakout forming 📊
Entry: $33.82 ✅ | Stop: $33.39 🛑
Target: $35.29 🎯 — potential reversal in play 📶
#SLB #LongTrade #EnergyStocks #StockMarket #TechnicalAnalysis #TradingView

RAMP on WatchLooking to buy a pullback around $32.50 or buy the gap close at $31.50
Why:
$32.50 is around .50 fib level
MACD looks ready to turn bullish
Price above all EMAs
