FFCFFC PSX STOCKs breakout Day Level Buy Call
Fundamental Strengths
Robust earnings growth:
FY 2024 net profit ~PKR 64.7 B vs ~PKR 29.7 B (2023) – EPS nearly doubled to PKR 45.49
Pakistan Stock Exchange
+15
StockAnalysis
+15
.
Q1 2025 EPS ~PKR 9.33 (Sep‑Nov on TTM ~PKR 66.6)
Pakistan Stock Exchange
.
Attractive valuation:
TTM P/E ~9.6× (TradingView shows ~6.6×—likely consolidated vs standalone) .
High dividend yield:
~8.7–9.9% yield in 2024, with a ~60% payout ratio
TradingView
.
Diversified portfolio:
Operations across fertiliser, power, food, banking (via Askari Bank), wind generation, phosphate JV – mitigating sector risk
TradingView
+1
+1
Strong ownership:
Backed by Fauji Foundation (~43% owner) – adds stability and governance credibility

#QS - 4HR [Will the last boost last or will it bust? With a new Volkswagen investment and partnership. Quantum Scape’s earnings were far from stellar with a 26% decrease in income compared to same time last year. They have, nevertheless, made advancements with their very promising lithium-Metal battery technology.
With fundamentals aside, I am curious to gauge how long-term investors have priced-in the company's stock price.
Technically, I see price moving to present yet another opportunity by EOY if not sooner. My count shows important levels to watch.
Go #QuantumScape, Go!!!
Check out my other chart ideas @CaxhPrince everywhere.

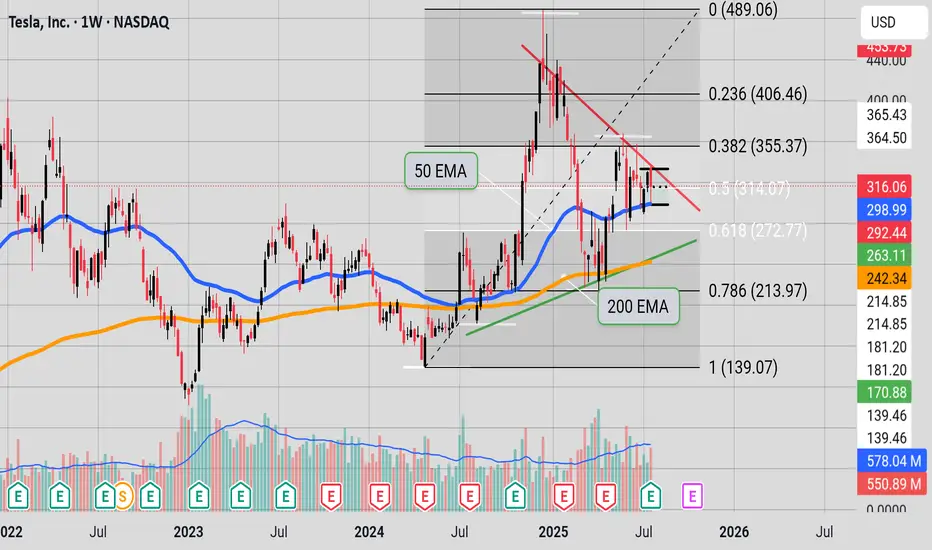
Inflection point"Tesla is at a binary point on the chart. The stock is wedged tightly between the red, downward-sloping resistance line (upper boundary) and the green, upward-sloping support line (lower boundary)—the classic apex of an asymmetrical triangle.
At this stage:
A breakout above the red resistance would be a clear bullish signal, potentially starting a new upward trend.
A rejection at resistance and breakdown below the green support would signal bearish momentum, with likely downside toward lower Fibonacci levels like 272.77 or 213.97.
With price at this inflection zone, the next decisive move—either up or down—will likely define Tesla’s short-to-medium-term trend. This is a textbook example of a binary technical situation: whichever direction is confirmed next, that’s likely to dictate the coming weeks' price action." (Some help from Perplexity)
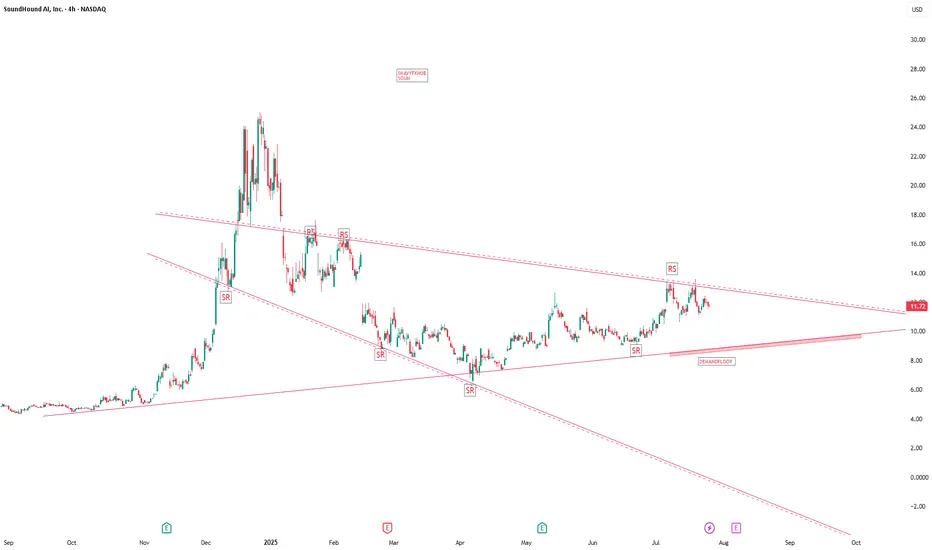
SOUNSoundHound AI — Company Overview and Latest Developments (July 2025)
What Is SoundHound AI?
SoundHound AI, Inc. (Nasdaq: SOUN) is a leading voice artificial intelligence (AI) company headquartered in Santa Clara, California. Founded in 2005 by Stanford graduates, it has evolved from music recognition app Midomi (later rebranded SoundHound) to a global innovator in conversational voice AI.
What Does SoundHound Do?
The company develops an independent voice AI platform that powers conversational interfaces for businesses across automotive, TV, IoT, restaurant, customer service, healthcare, retail, finance, and more.
SoundHound's platform allows enterprises to create custom voice assistants, voice-enable products, deliver hands-free customer service, and gather valuable conversational analytics.
Key Products and Technologies
Product/Technology What It Does
Houndify Platform Suite of APIs, SDKs, and tools for building custom voice and conversational assistants for enterprise, auto, and consumer tech.
SoundHound Chat AI Advanced conversational assistant integrating generative AI and real-time data (weather, stocks, restaurants, etc.).
Smart Ordering AI-driven ordering for restaurants (drive-thru, kiosk, phone, and in-car).
Dynamic Drive Thru End-to-end voice interactions for fast-food and QSR environments.
Smart Answering Automated, always-available phone agent for customer calls.
Voice Commerce Ecosystem for ordering, payments, and pickup, notably powering new in-vehicle ordering.
Employee Assist AI agent to help staff with information, ordering, and support tasks.
Tech Stack Proprietary Speech-to-Meaning®, Deep Meaning Understanding®, Natural Language Understanding (NLU), ASR, TTS, Edge/Cloud.
Supports 25 languages and holds over 250 patents in conversational AI technologies.
Branded wake words, cloud/edge integration, and automatic content recognition are key differentiators.
Recent News & Major Highlights (2025)
CES 2025 Launch: Unveiled the industry’s first in-vehicle voice assistant enabling on-the-go food ordering—lets drivers order and pay for meals directly from car infotainment systems.
Restaurant Industry Expansion: Live demos at the National Restaurant Association Show showcased drive-thru, phone, kiosk, and in-car voice ordering, with AI now powering ordering in 10,000+ restaurant locations.
Acquisitions: Recently acquired Amelia (enterprise automation software) and Synq3 Restaurant Solutions, boosting its capabilities and reach in both enterprise and hospitality sectors.
Automotive & Enterprise Traction: Now in 20+ auto brands and sectors like healthcare, finance, and utilities, with strategic partnerships like OpenAI-powered voice AI in Stellantis vehicles.
Financial Growth: Company reports strong cash position ($200M, no debt), expects EBITDA positivity by year-end, and projects robust growth with expanding voice commerce opportunities.
Revenue Model and Growth
SoundHound's business relies on royalty licensing (hardware voice enablement), recurring subscriptions (for services like restaurant AI), and voice commerce (cut from voice-enabled orders), with growing adoption in cars, devices, and quick-service restaurants.
Summary:
SoundHound AI is a top player in the conversational AI space, voice-enabling products and services for enterprises worldwide, especially in automotive, retail, and hospitality. Its latest innovations—like in-car food ordering and expanded restaurant solutions—reflect aggressive growth and increasing real-world impact for AI-powered voice technology
Yum! Brands Inc. (YUM) – Potential Head & Shoulders Breakdown📉 Short Setup
🔍 Description:
Yum! Brands Inc. (NYSE: YUM) appears to be forming a Head & Shoulders pattern — a potential bearish reversal signal. The neckline support is holding for now, but a confirmed breakdown below this level would suggest downside momentum.
📊 Trade Details:
🔹 Entry: Below neckline confirmation (close under support)
🔴 Stop Loss: 153.05
🟢 Target: 138.30
📌 Confirmation:
Watch for a decisive close below the neckline to confirm breakdown. If the neckline holds, this setup could fail, and price may remain range-bound or reverse back up.
Trade safe! 📉✅

AT&T – Still Ringing?AT&T. The name alone evokes landlines, long-distance charges, and a time when phones had cords (and possibly rotary dials). But don’t let the vintage vibes fool you — this telecom titan might still have some signal left on the price chart.
Now, I’m not saying AT&T is about to moonwalk up the NASDAQ leaderboard — but I’ve seen slower giants pick up speed. And if you squint just right, the chart has been whispering, "Maybe I’m not dead yet."
From a chart perspective:
After what felt like years of sideways static, the price may finally be picking up a bar or two. Recent structure hints at a potential trend reversal — or at least a modest attempt to climb out of the basement. Support levels are holding like a stubborn dial-up connection, and the candles are starting to lean north.
Is this the beginning of a full-blown comeback or just a dead-cat bounce in a trench coat? Hard to say. But I’m watching with interest — and maybe a little nostalgic hope that this once-glorious phone company still has some long-distance strength left in it.
No guarantees, no predictions — just one person watching a chart and thinking: "This thing might still be ringing."
A lighthearted market musing, not financial advice!

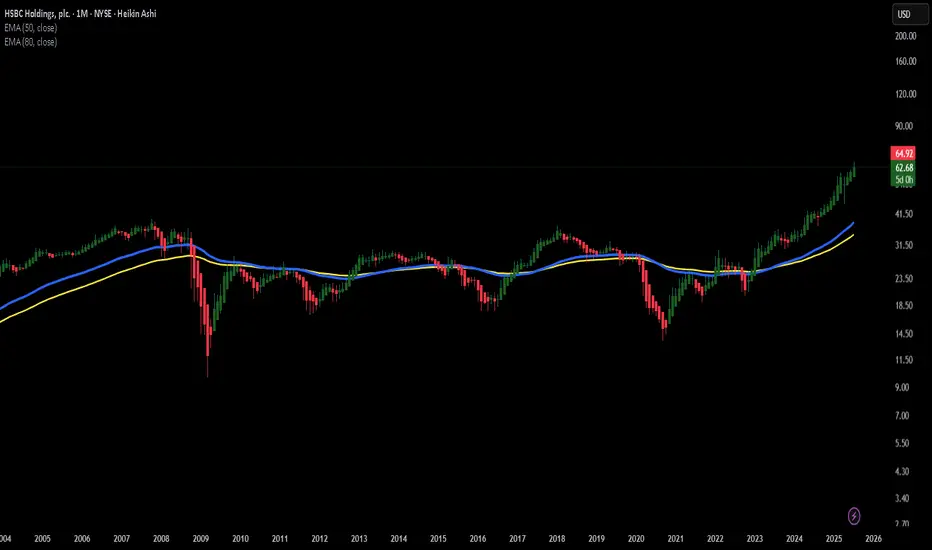
HSBC – Big Bank EnergyHSBC. The name alone sounds like it should be engraved in stone above a massive marble doorway somewhere in London, guarded by two lions in tuxedos. It’s one of those banks that’s been around forever – the kind of institution that probably has an emergency plan for a meteor strike… and a tea protocol for after.
And yet, when I look at the chart, I don’t just see a slow-moving financial giant. I see a potentially elegant bulldozer gently carving its way upward. Recent price action has been forming what looks like a series of higher lows, and we might just be watching a classic "big-bank-breakout" in slow motion.
From a chart perspective:
Price has been flirting with key resistance, perhaps like a banker flirts with risk – cautiously, from a safe distance, and only with proper documentation. But if momentum keeps building, it might finally stop sipping tea and actually make a move. Possibly upward. Possibly politely.
There’s no guarantee, of course. This isn’t a prediction – more like the market equivalent of a raised eyebrow and a curious “hmm.” I’ll be keeping an eye on HSBC to see if this old titan is ready to shake off the pinstripes and surprise us all.
A lighthearted market musing, not financial advice!
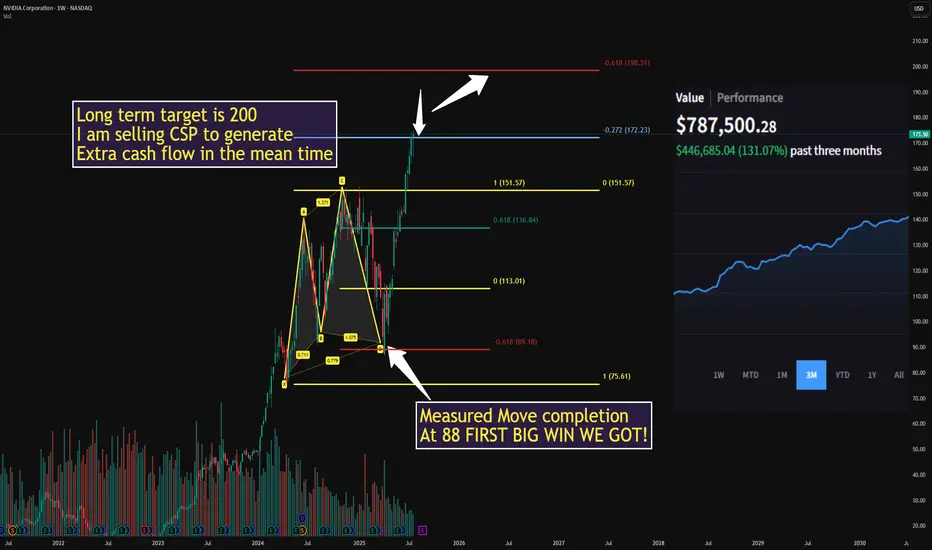
$NVDA ONCE IN A LIFETIME from 88 to 174 BOOM!WE crushed it using the 618 measured move from 88 to 174 in April
Next target is 200 and I am waiting for a decent pull back
In the mean time I will sell puts to generate cash flow, I will alert my next buy here
NO CHARGE all I ask is drop a LIKE
SoFi: On the Road to ATH ResistanceAfter clearing over 100 lines off my chart, I wanted to take a clean, fresh look at SoFi heading into the upcoming earnings report — just to gain a new perspective on where we stand.
Weekly chart. As simple as it gets.
What I’m seeing: a breakout from a classic cup-and-handle formation, with the breakout point around $16.5.
This setup carries potential for a move toward all-time highs near $28.
— Important note:
A pullback to the $16.5 zone would still not break the breakout structure — in fact, this would be a textbook retest of the breakout level.
Yes, there’s still room for a ~20% downside from current levels, but this would still be within the structure of a larger bullish move toward ATH.
No doubt in my mind — if we revisit $16.5, I’ll be loading up on SOFI like crazy.

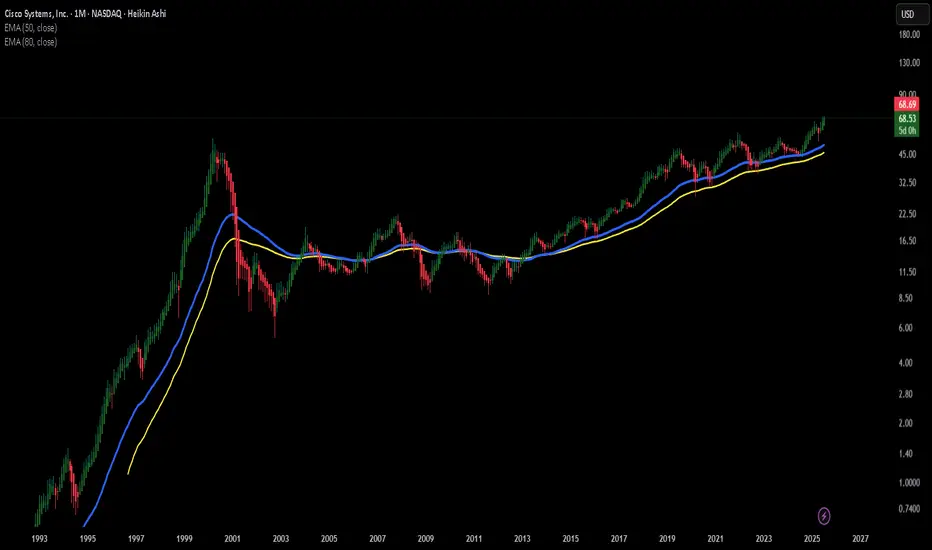
CSCO – Cisco’s Not Done Dancing Yet!
When I look at CSCO, I get the feeling that this old-school tech legend still has some rhythm left in its step. It’s like that uncle at the family wedding who’s been around the block but somehow still manages to pull off a surprisingly smooth move on the dance floor.
It may not be the flashiest stock on the NASDAQ, but there’s something about the way it moves – slow, steady, confident – that makes me think it might just be preparing for another swing to the upside.
From a chart perspective:
Recently, CSCO has been respecting a rising trendline and forming a sequence of higher lows – a classic sign of underlying strength. The price is now approaching a zone that has previously acted as resistance. If momentum builds, this level could turn into a launchpad. Of course, the market doesn’t always follow the script, but the setup looks promising from where I stand.
No predictions, no guarantees – just one trader’s interpretation of the chart. If Cisco keeps moving like this, I’ll be following the rhythm with curiosity (and maybe a fresh cup of coffee).
A lighthearted market musing, not financial advice!
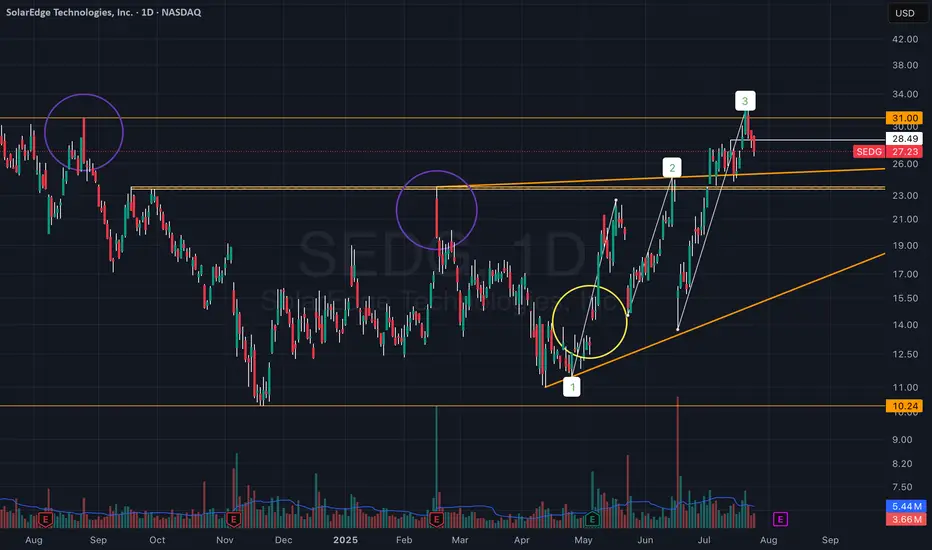
Are We Witnessing a Trend Reversal in SEDG?Something I’ve been watching closely these past few days — SEDG (SolarEdge):
There’s a setup unfolding that I think could benefit from a few more eyes on it:
• The two purple circles mark large vector candles that initiated sharp downward moves.
• The yellow circle highlights the quarterly earnings release, which triggered a strong upward move toward the $20–24 zone — the area of the first vector candle.
These vector candles reflect strong institutional activity that clearly impacted price movement.
A breakout above these zones could signal a meaningful trend reversal forming in the stock.
Price was rejected twice from this area with strong dips, but on the third attempt, it broke through, reaching the next vector candle zone around $26–31.
Now, price is approaching this upper zone with strong momentum following the breakout.
After reviewing the recent earnings report, I noticed a clear recovery and a significant upward revision in guidance, suggesting the company may be shifting direction.
Whether this holds is uncertain — but price action suggests the market is pricing in real change.
We recently printed a high of $32.45, above the $31 vector zone — a notable sign of strength.
At the moment, we appear to be pulling back into support, and structure remains intact.
Yes, there’s clearly a strong battle happening now — but I’m convinced the momentum is with the bulls.
It feels like someone already knows what’s coming in the next earnings release, or at least senses a shift in the company’s trajectory.
Everything seems to be building toward the next earnings report, expected early August.
SoFi's Surge: Unveiling 2023 and What Lies Ahead in 2024Technical Analysis Overview
Current Price : $10.34, a 3.77% increase.
Weekly Trend : Showing a positive trend with a 5.35% increase over the last five days.
1-Month Trend : A significant increase of 51.96%, indicating strong bullish sentiment.
6-Month and Yearly Trends : A 17.04% increase over the last six months and a 124.51% increase year to date, highlighting a robust bullish trend.
Advanced Technical Indicators
Relative Strength Index (RSI) : 70.41 - Indicating that SOFI is nearing overbought territory, which could lead to a potential reversal or consolidation in the short term.
Moving Average Convergence Divergence (MACD) : 0.63 - Suggesting bullish momentum, indicating a strong buying trend.
Other Indicators : STOCH (83.28), STOCHRSI (84.02), ADX (37.09), Williams %R (-8.57), CCI (104.63), ATR (0.46), Ultimate Oscillator (54.76), and ROC (24.66) all contribute to a picture of current bullish momentum but with potential for short-term volatility or pullback.
Market Sentiment and External Factors
Market Capitalization : $9.904B USD.
Trading Volume Analysis : A high trading volume of 35,199,288, suggesting active market participation and interest in the stock.
Recent News Coverage Impacting SOFI
Bullish Outlook for 2024 : Analysts predict SOFI stock could continue its rally in the new year, benefiting from expected interest-rate cuts. A notable analyst has set a high price target of $14 for SOFI stock, implying significant upside potential ( InvestorPlace ).
Focus on Non-Lending Businesses : Analysts appreciate SoFi's shift towards non-lending businesses, improving earnings quality despite a higher-for-longer interest-rate policy.
Central Bank Policy Changes : Potential interest rate cuts in 2024 could benefit SoFi's lending business, as lower rates tend to spur borrowing and lending activity.
Conclusion
SOFI's stock shows strong bullish signs in the medium to long term, but the current overbought condition warrants caution for short-term traders.
The recent news and analyst predictions provide a positive outlook for 2024, making SOFI an interesting stock for both traders and long-term investors.

Apple Inc. (NASDAQ: AAPL) – Potential Breakout from Bullish ABCDApple has recently formed a well-structured ABCDE corrective pattern inside a broader sideways range, suggesting accumulation and possible trend continuation on breakout.
Technical Breakdown:
🔸 ABCDE Formation: The structure resembles a contracting triangle or bullish consolidation, marked by higher lows (A, C, E) and lower highs (B, D), signaling price compression.
🔼 Breakout Zone: Price has moved above point (D) briefly and is now consolidating around the $214 zone. A strong close above this could lead to continuation toward the $237 and $260 resistance levels.
🔻 Support Levels:
Minor support at $207.45
Strong base support near $193.44 (ABC low)
📈 Volume Spike: The most recent leg from E to D showed a significant volume surge, indicating possible institutional interest or breakout anticipation.
🔍 Trade Outlook:
A sustained move above $217–$218 with volume could trigger a bullish breakout.
Targets:
First: $237.33 (recent horizontal resistance)
Next: $260.15 (gap-fill or prior high zone)
Risk Management: A drop below $207 would invalidate the structure and suggest further range-bound behavior or downside.
⚠️ Disclaimer: This chart is for educational purposes only. We are sharing a trade setup based on technical signals generated by our private invite-only indicator. This is not financial advice or a recommendation to buy or sell any financial instrument.
📊 The indicator highlights potential buy/sell zones based on a custom strategy developed by our team. In this chart, we are demonstrating how the signal aligned with market structure and trend conditions.
🛑 Regulatory Note: We are an independent development team. Our private indicator and services are not registered or licensed by any regulatory body in India, the U.S., the U.K., or any global financial authority. Please consult a licensed advisor before making trading decisions.

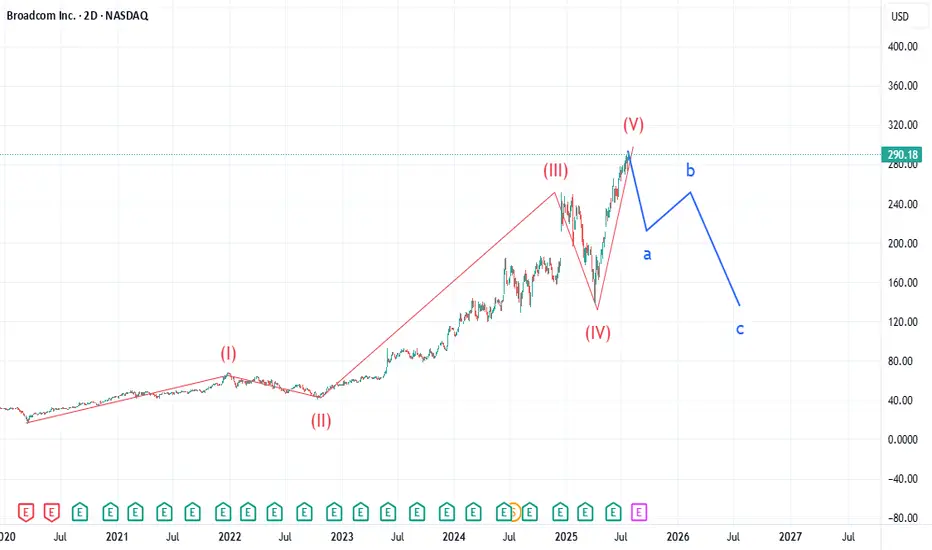
AVGO: Too Many Similarities Market WideLike my chart on BKNG, AVGO is showing an uncanny similarity to Booking.com's chart. Many indices are showing the end of 5 waves in a super cycle dating back to the drop of March 2020. AVGO pt1 is 211. Expecting selling to increase over the next 90 days. Not certain what the catalyst will be, but looking for a major drop in equities over the next 2 weeks. Check IBM chart. I called that drop last week and many stocks will have a similar gap down structure over the next 2 weeks from what I am tracking.
SBI LIFE INSURANCE CO LTD Breakout Watch Above ConsolidationSBI Life has been consolidating in a sideways range between approximately ₹1,770 and ₹1,860 for over 40 days. The price recently tested the upper boundary of this range and closed near the resistance with strong bullish momentum and above-average volume, signaling potential accumulation and a likely breakout attempt.
Technical Highlights:
Range-bound structure: The stock traded in a narrow horizontal channel for over a month, indicating a base formation.
Bullish breakout attempt: Today’s strong green candle with a +2.15% gain is testing the upper resistance zone.
Volume confirmation: The breakout move was supported by a significant volume spike, suggesting increased institutional activity.
Volatility contraction: The tight price action before this move signals a potential volatility expansion, typically preceding a trend.
Potential Price Path:
If the price sustains above ₹1,860 with follow-through buying, the next key resistance levels are projected around ₹2,020–₹2,200.
⚠️ Disclaimer: This chart is for educational purposes only. We are sharing a trade setup based on technical signals generated by our private invite-only indicator. This is not financial advice or a recommendation to buy or sell any financial instrument.
📊 The indicator highlights potential buy/sell zones based on a custom strategy developed by our team. In this chart, we are demonstrating how the signal aligned with market structure and trend conditions.
🛑 Regulatory Note: We are an independent development team. Our private indicator and services are not registered or licensed by any regulatory body in India, the U.S., the U.K., or any global financial authority. Please consult a licensed advisor before making trading decisions.

BKNG: Catalyst for the drop - EarningsBKNG has completed a super cycle 5 wave structure beginning at the completion of the March 2020 COVID drop. First target is 4030 by EOY to early next year. Many other stocks are showing a similar structure, so expecting selling volume to greatly increase over the next 90 days.

$CORZ LoadedTime Frame: 1D
RSI : Bullish
MACD: Bearish, looking for momentum
Fib Levels: Retraced back to 50.0%
Target: $16.28
Pattern invalidated of drop below 61.8% ($10.94) Fib level.

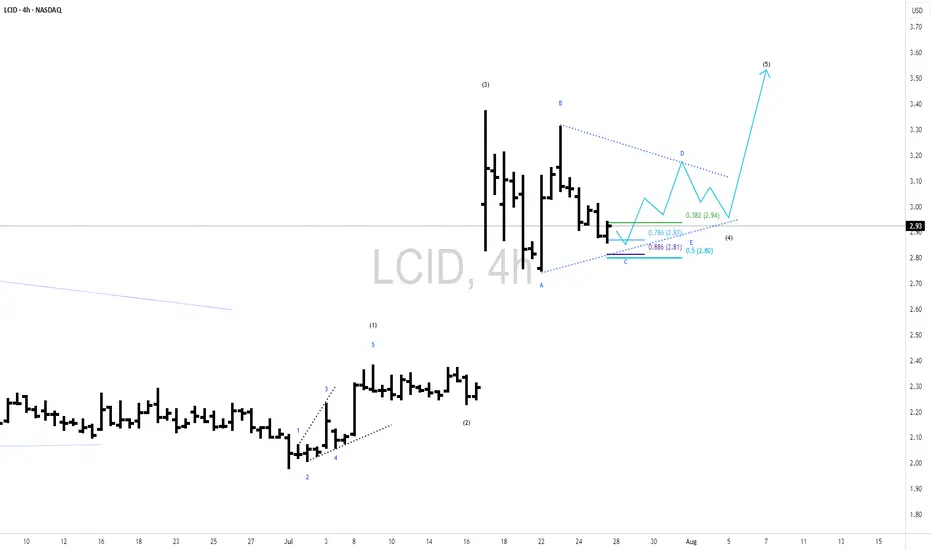
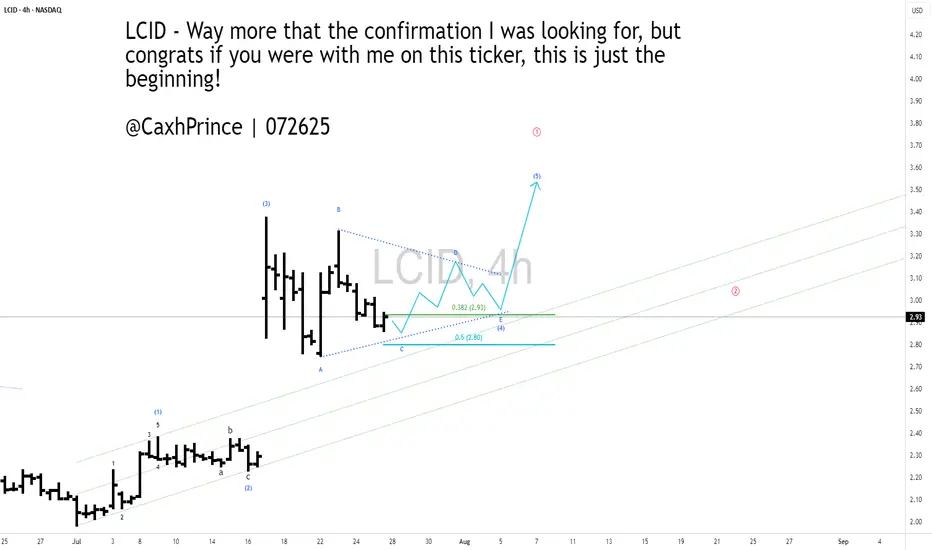
#LCID - 4HR [ A potential bullish view]Lucid blasted off last week with the collaboration of Uber and Robo-taxis. I think that blast infused more investors to the stock and I think it may never come back to take out its lows. If it does, I would load up more on it. I like their designs and the fact that they are now compatible with TESLA's Super Chargers make them even more attractive.
In my count here, I am sensing the current correction could form a triangular pattern for another high before one last correction for ABC down.
Go LCID, Go!!!
Check out my other chart ideas @CaxhPrince everywhere.

ARPL is on the GO and bracing it self for an upward moveDuring the last trading session as of Friday a fresh volume to the tune of 2270% got added, which In absolute value, comes to 54549. Total day end volumes as of yesterday/s trading session were 56518 and these are or were approx. more than 6x of the Avg Vol 10 days and more than 5x of the Avg Vol 20 days....
Daily RSI at 73.47 and Weekly at 61.57. ADX is at 21, implying gearing up for a good move Up.
Lets c how how things go further.....
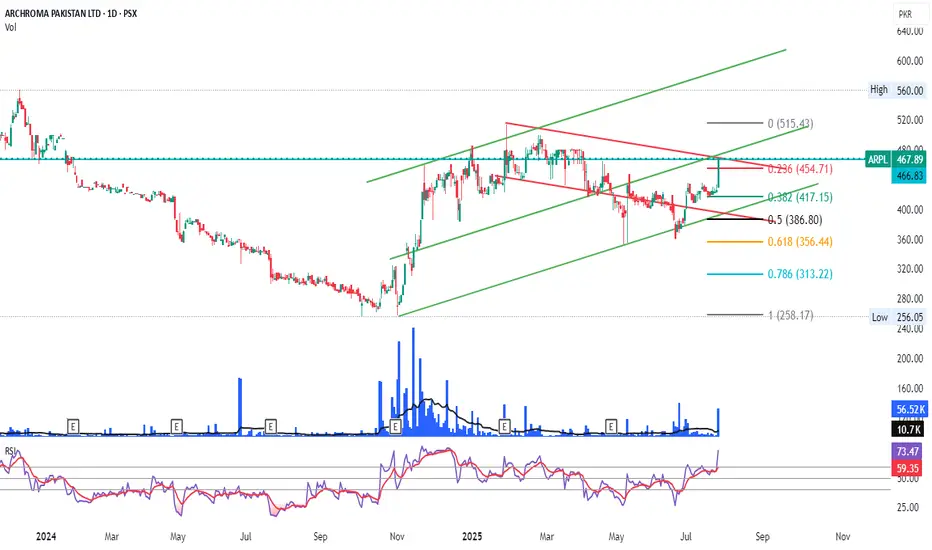
Volume indicates ... people are interested in this stock All info updated on chart. Volume buzz seen on weekly chart. Price levels given. Divergence visible. Capex done 2-3 ago, outcome not yet visible in past results. Lets see here on numbers may improve.

A 4HR Bullish view on #Lucid Motors ($LCID)Lucid blasted off last week with the collaboration of Uber and Robo-taxis. I think that blast infused more investors to the stock and I think it may never come back to take out its lows. If it does, I would load up more on it. I like their designs and the fact that they are now compatible with TESLA's Super Chargers make them even more attractive.
In my count here, I am sensing the current correction could form a triangular pattern for another high before one last correction for ABC down.
Go LCID, Go!!!
Check out my other chart ideas @CaxhPrince everywhere.
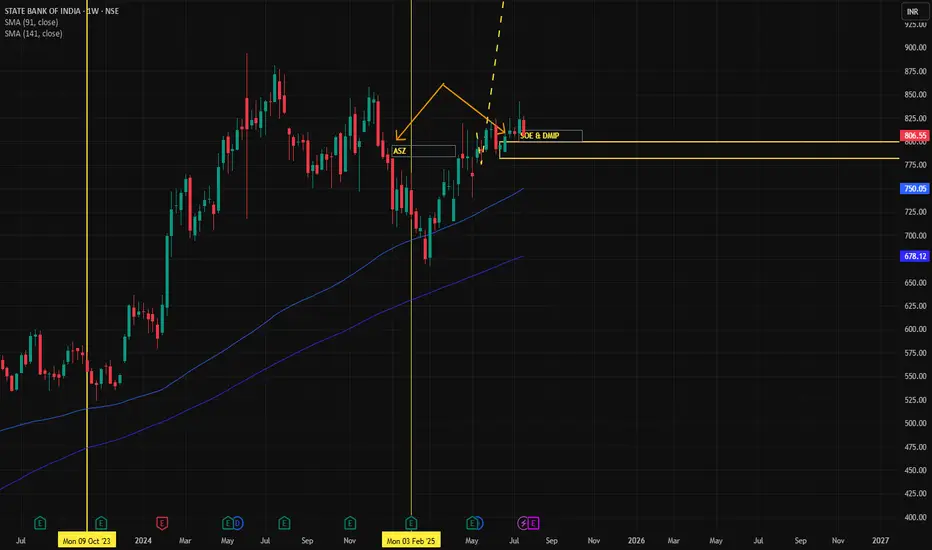
SBIN✅ Updated Trade Plan Summary
✅ Updated Trade Plan Summary
Metric Previous Value Updated Value
Entry 800 800
Stop Loss (SL) 757 775
Risk 43 25
Target 1256 1256
Reward 456 456
Risk-Reward (RR) 10.6 18.2
🔍 Implications of the Change
🔽 Risk reduced from 43 to 25 points
✅ RR improved significantly from 10.6 to 18.2, showing a more optimized entry
🔐 Stop Loss at 775 is now just below the Daily Demand zone (775–757) — tighter but still inside structure
🎯 Target remains the same, making the setup more efficient from a capital allocation and position sizing standpoint
⚠️ Caution Point
SL is just at the edge of the Daily Proximal Zone. If there's volatility and a liquidity grab below 775, there’s a minor risk of being wicked out before direction resumes.
You may consider partial entry or buffer SL at 770 if price volatility is high.
🧠 Key Trade Logic Still Holds
All Higher, Mid, and Intraday Timeframes show strong UP trend.
ASZ + DMIP + SOE confirmation from Weekly zone at 799 still valid.
Price trades well above Gann level of 766 and above ITF Demand clusters (782–787).
Weekly Demand at 800–780 is your live demand engine.
📌 Supportive Zones Recap
Timeframe Demand Zone (Proximal–Distal)
Weekly 800 – 780
Daily 775 – 757
ITF (Avg) 788 – 782
📈 Conclusion
This is an optimized entry with better RR (now 18.2), assuming volatility is managed.
Good structure, strong MTF alignment, and you're sitting inside the Weekly Demand Zone.
Monitor 775-770 zone — if broken with volume, re-evaluation may be needed.
My thoughts on LCID-4HRLucid blasted off last week with the collaboration of Uber and Robo-taxis. I think that blast infused more investors to the stock and I think it may never come back to take out its lows. If it does, I would load up more on it. I like their designs and the fact that they are now compatible with TESLA's Super Chargers make them even more attractive.
In my count here, I am sensing the current correction could form a triangular pattern for another high before one last correction for ABC down.
Go LCID, Go!!!
Check out my other chart ideas @CaxhPrince everywhere.