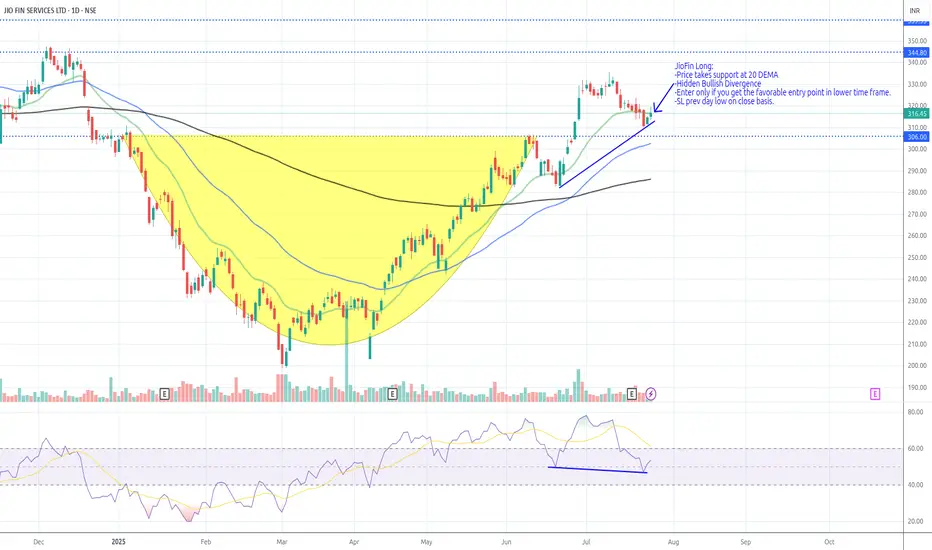
JioFin Long_Support @ 20 DEMAJioFin Long:
-Price takes support at 20 DEMA
-Hidden Bullish Divergence
-Enter only if you get the favorable entry point in lower time frame.
-SL prev day low on close basis.
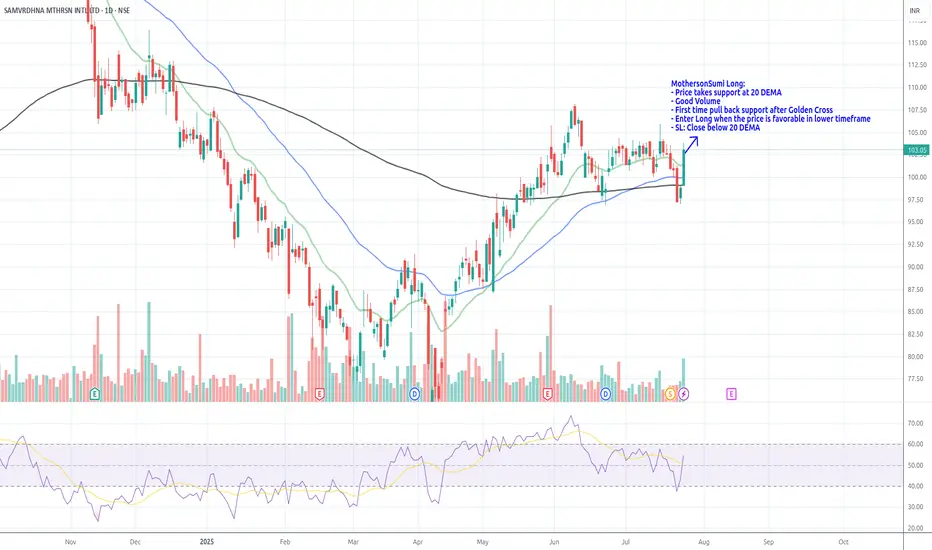
MothersonSumi Long_Support @ 20 DEMAMothersonSumi Long:
- Price takes support at 20 DEMA
- Good Volume
- First time pull back support after Golden Cross
- Enter Long when the price is favorable in lower timeframe
- SL: Close below 20 DEMA
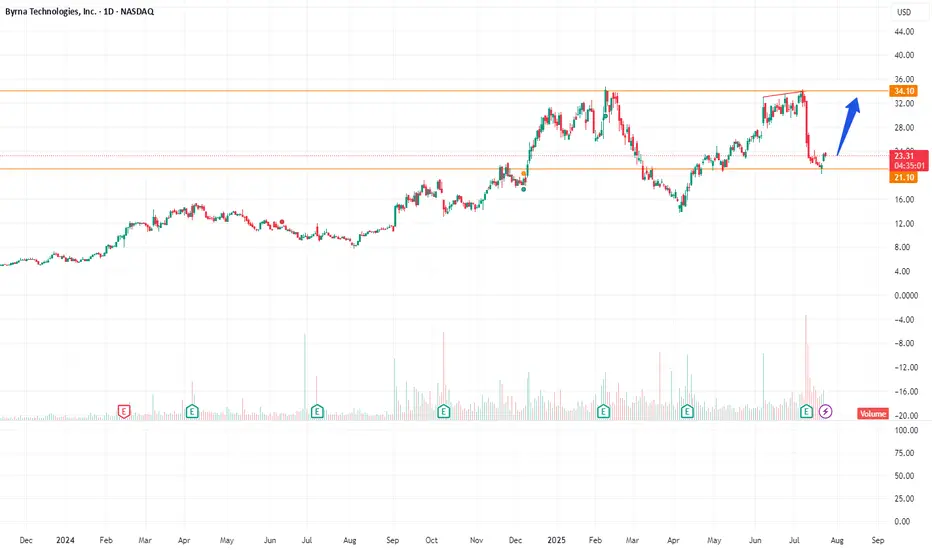
BYRN again looks good at cmp1. Company Profile
Byrna Technologies Inc., headquartered in Andover, Massachusetts, is a technology company within the Aerospace & Defense sector. Founded in 2005 (originally named Security Devices International), it rebranded to Byrna Technologies in March 2020
It develops, manufactures, and sells less-lethal personal security solutions, serving both consumers and professional security clients across the U.S., South America, Europe, Asia, Canada, and South Africa
2. Core Products & Innovation
Flagship Launchers:
Byrna SD: A handheld, CO₂-powered launcher with patented "first-shot pull-pierce" technology to prevent gas leakage over time.
Byrna CL (Compact Launcher): Launched in FY 2025, 38% smaller than the SD version, but still delivers comparable force. Now available via Amazon and featured prominently during Prime Day
.
Complementary Offerings:
Less‑lethal projectiles (chemical irritant, kinetic, inert rounds)
Aerosol products (like Byrna Bad Guy Repellent)
Accessories and safety gear (e.g. holsters, CO₂ canisters, sighting systems, Byrna-branded apparel)
3. Distribution Channels & Market Access
E-commerce: Direct-to-consumer via Byrna's site and Amazon store.
Dealer Programs: Side Hustle dealer network and premier dealers.
Retail Partnerships: High‑impact "store‑within‑a‑store" rollouts with Sportsman’s Warehouse. Expanded from 11 pilot locations in early 2025 to plans for 50 by year-end and 100 by end of 2026
.
4. Growth, Financial Performance & Capital Structure
Top-Line Growth:
Q1 2025 revenue: $26.2M (+57% YoY)
Q2 2025 revenue: $28.5M (+41% YoY)
Profitability & Margins:
Q2 2025 net income: $2.4M, gross margin: ~62%
Q1 2025 EPS: ~$0.07; marked improvement from breakeven prior periods
Balance Sheet & Cash Position:
As of May 31, 2025: Cash & marketable securities ~$13M, debt-free, with increased inventory ahead of new product launches.
As of March 31, 2025: Total assets ~$77M, total liabilities ~$17M, and shareholders’ equity ~$60M
Stock Titan
7. Key Strengths & Risks
✅ Strengths
No debt and improving cash generation.
Rapid revenue growth and turning consistently profitable quarter-over-quarter.
Diversified sales channels: DTC, retail, dealers, international.
Strong brand-building through influencers and multi-channel presence.
Scalable and increasingly domestic supply chain ensures quality and reliability.
⚠️ Risks
Reliance on celebrity-driven marketing and consumer sentiment.
Regulatory uncertainty in jurisdictions restricting less-lethal devices (e.g. New York City).
Potential classification or reclassification of devices under stricter legal regimes.
Inventory-heavy balance sheet could burden liquidity if demand slows.
Short interest (~12%), indicating bearish sentiment among some traders. Recent share float ~22.7M shares outstanding
📌 Summary
Byrna Technologies operates at the intersection of technology, security, and consumer convenience, offering innovative less-lethal defense products that bridge the gap between traditional firearms and personal safety devices. With strong financial momentum, strategic retail expansion (Sportsmans’ Warehouse and physical stores), and powerful branding via influencers, the company is positioning itself for accelerated growth.
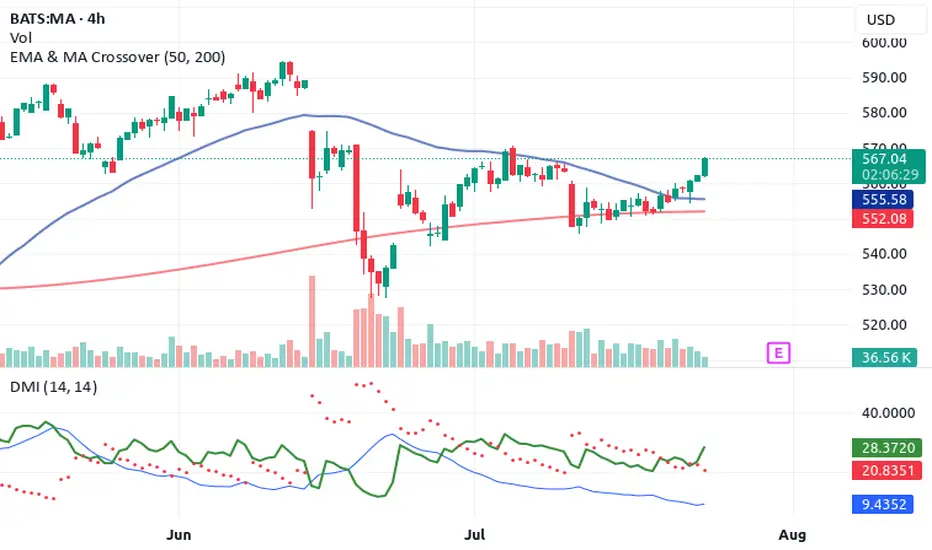
Top 4 Buy Signals Lighting Up Mastercard (MA) 🚀 Top 4 Buy Signals Lighting Up Mastercard (MA) | Rocket Booster Strategy
Mastercard Inc. (MA) is showing explosive potential, and it’s not just one signal—it’s a whole confluence of confirmations. When
you align this much market momentum, you don’t ignore it. Let’s break down how Rocket Booster Strategy gives us a powerful buy indication on the daily chart.
🔍 The Confluence Setup
✅ 1. DMI Buy Signal
The Directional Movement Index (DMI) is in bull mode. ADX is
rising and the +DI is firmly above -DI. This shows the trend is not just alive—it’s gaining strength.
🔻 2. Volume Oscillator Pullback
While Volume Oscillator is down, this is seen as constructive and not bearish. It suggests a quiet zone before the thrust—just like fuel loading before a rocket launch.
Smart traders know: momentum can build silently.
💥 3. Awesome Oscillator = Strong Buy
The Awesome Oscillator is green and firing hard. We’ve seen a clear twin-peak bullish formation followed by a break above zero
—classic acceleration sign.
🕯️ 4. Rising Window (Japanese Candlestick Pattern)
A Rising Window—a bullish continuation gap—has formed. This is one of Steve Nison’s top continuation patterns. It signals strong
institutional conviction in this trend.
📈 What Does This Mean?
When DMI, AO, candlestick patterns, and our own Rocket Booster Strategy all point up, it’s time to pay attention. This setup is rare—and high-probability.
🧠 Rocket Booster Strategy Recap
This strategy uses 3 momentum alignment points:
High Momentum Indicator (like AO) in Buy Mode
Pattern Confirmation (Rising Window or Engulfing)
Volume Correction Before Breakout (Fuel Before Fire)
When all 3 click into place, we have ignition.
🎯 Final Thoughts
Mastercard is looking primed for takeoff on the daily timeframe. Whether you’re an investor or a swing trader, this chart is
speaking loud and clear. But as always, risk management is your co-pilot.
✅ Add it to your watchlist.
🚀 Simulate entries.
🧠 Trust the confluence.
Rocket Boost This Content To Learn More
Disclaimer: This is not financial advice. Always use a simulation/demo account before committing real capital. Trade responsibly.
i am long on ONTOOnto Innovation, Inc. (NYSE: ONTO) is a mid-cap company in the semiconductor equipment sector, offering metrology, defect inspection, lithography tools, and software for chipmakers
It’s been a volatile stock, down ~53% over the past year, with its 52‑week range at about $85.88–$228.42
Average Wall Street target: ≈ $135–142, suggesting ~40–46% upside from the ~$98 current price.
Low edge: $90 — implies ~10% downside.
High edge: $190 — implies nearly +94% upside.
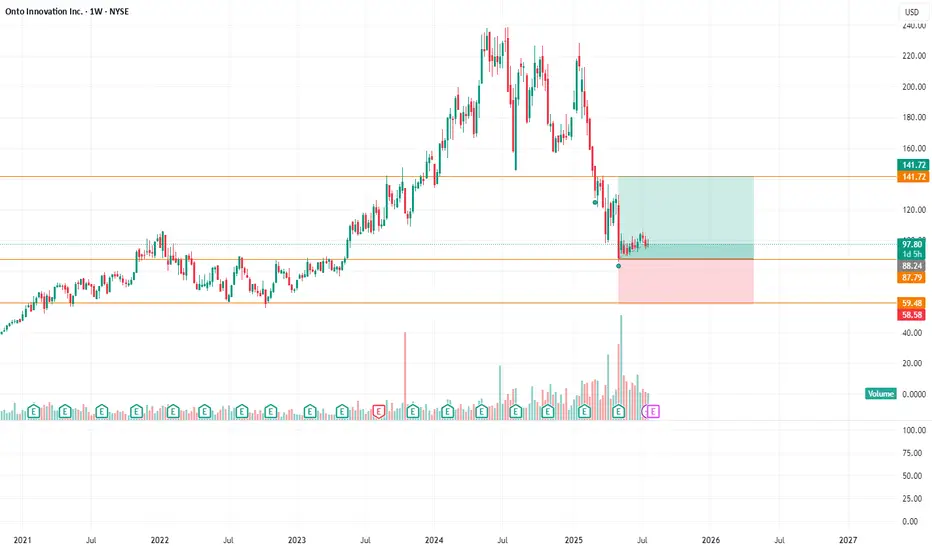
Bullish flow I grabbed the 15c Jan today chart setup looks good I know there's an active lawsuit going on DYOR but the flow calls have been active. Add to your watchlist atleast incase we get a dump.
Visa: Waiting in the Wings Visa has entered a phase of sideways consolidation — but this does not affect our primary scenario. We continue to see the stock moving within magenta wave , which is expected to complete the larger turquoise wave 4 inside our turquoise Target Zone between $308.09 and $292.19. After that, we anticipate a renewed upward impulse. Turquoise wave 5 should then push the stock beyond the resistance levels at $375.51 and $394.49. Meanwhile, we are keeping two alternatives on our radar. The first has a 35% probability and assumes the correction is already over, meaning turquoise wave alt.4 is complete. The second is a more bearish scenario (32% probability) visible on the daily chart. It suggests that the high of green wave alt. may already be in, which would imply that the ongoing alt. wave is headed toward a lower low below the $234.30 support level.
📈 Over 190 precise analyses, clear entry points, and defined Target Zones - that's what we do (for more: look to the right).

NMDC BuyNMDC break above channel pattern. Also, there is a break above of a triangle pattern. Buy @CMP (73) with SL of 69 and Target of 80, 90 & 95.

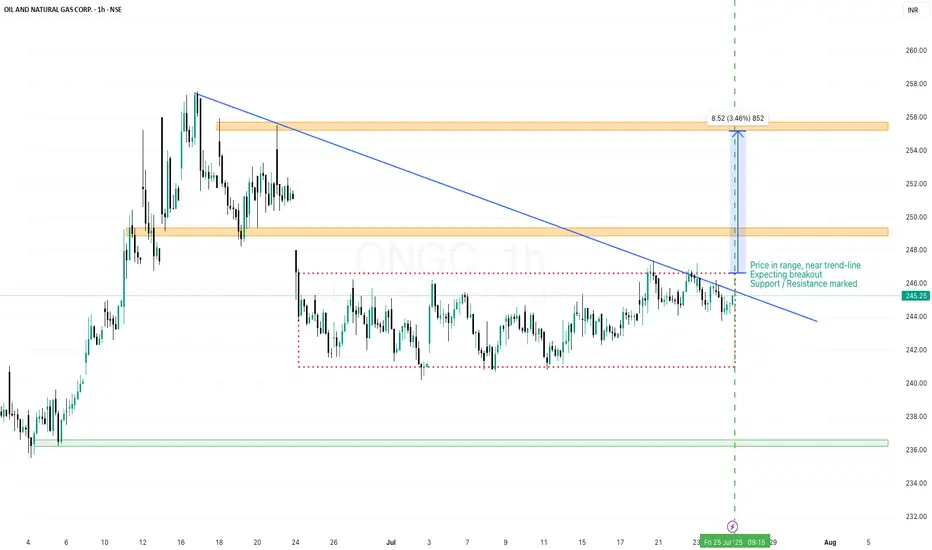
ONGC - Time to breakout from the Darvas boxONGC has been consolidating within Darvas box in recent days and nearing trend-line. We can expect breakout when trend line breaks. Nearest Support & Resistance marked for Target levels
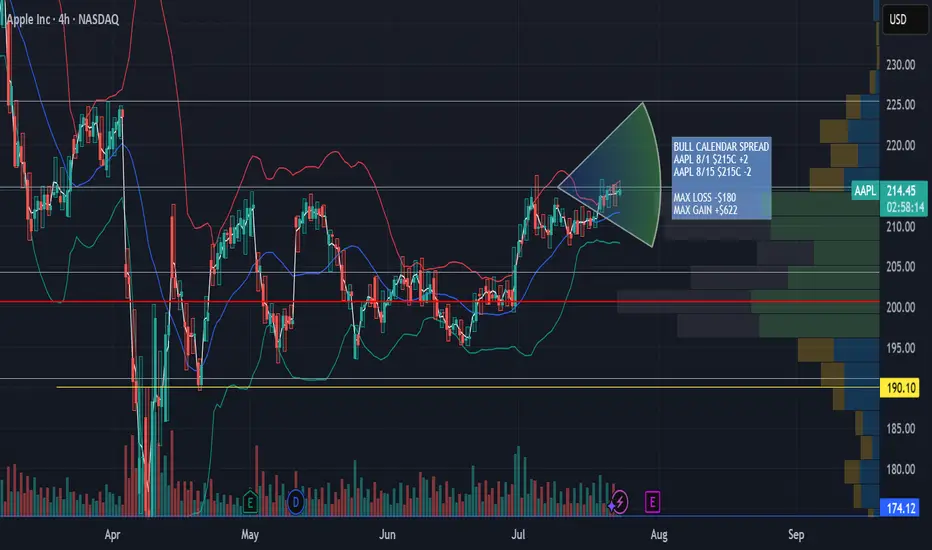
AAPL Aug 1st - Aug 8th 215 Calendar Call SpreadAAPL Aug 1st - Aug 8th 215 Calendar Call Spread
AAPL earnings after market close 7/31/25. Looking for an upward move into earnings with resistance at $225 then retesting support at $215. This zone falls between the .5 and .618 fib retracement. Great risk/ reward ratio 3.5:1
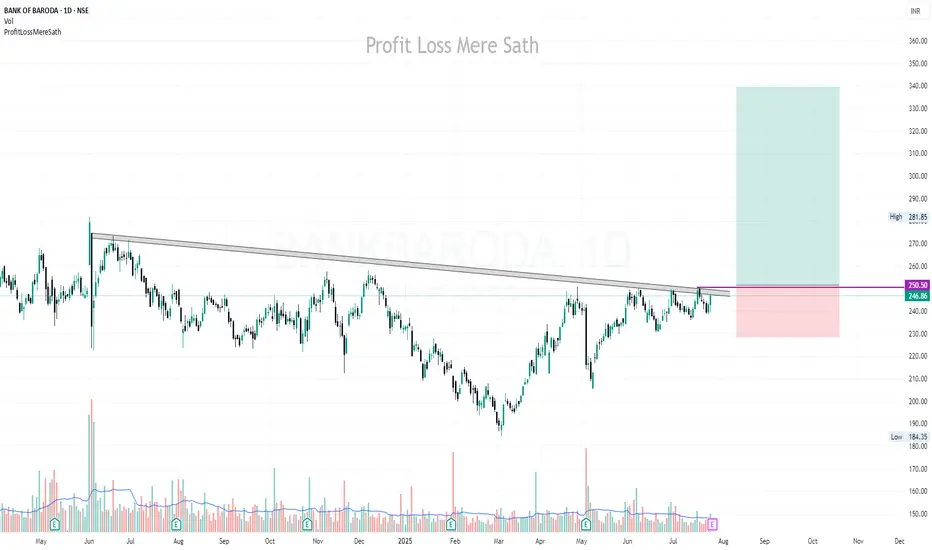
**BANKBARODA** | Buy above 251 | SL below 225 | Target 340Disclaimer:
This is not financial advice. Please do your own research or consult with a financial advisor before making any investment decisions. Investments in stocks can be risky and may result in loss of capital.
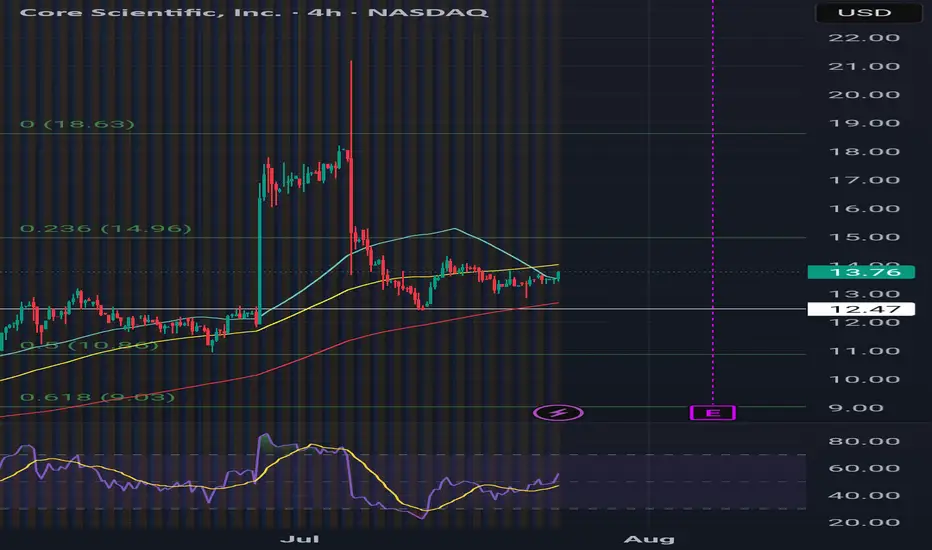
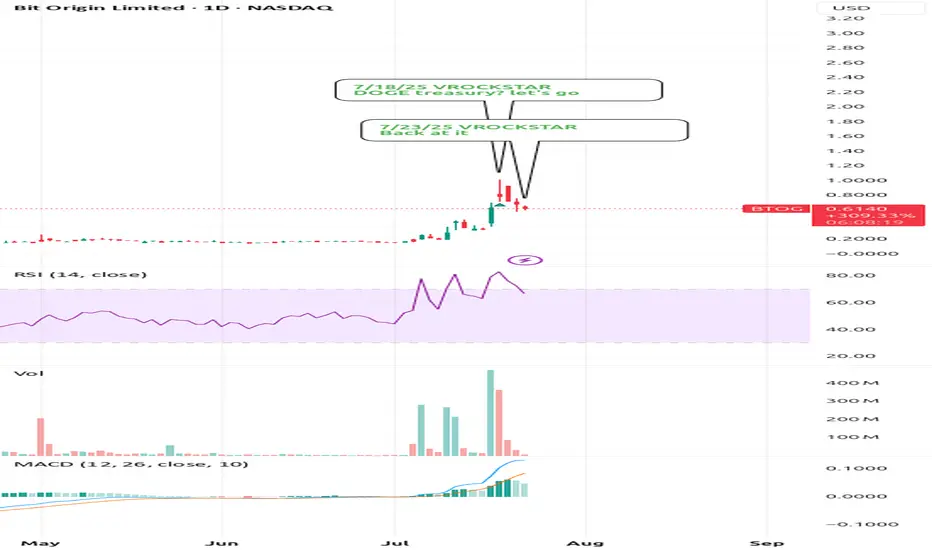
7/23/25 - $btog - Back at it7/23/25 :: VROCKSTAR :: NASDAQ:BTOG
Back at it
- not much to say except this thing holds about 70c worth of CRYPTOCAP:DOGE
- CRYPTOCAP:DOGE < $BTC. let's get that out of the way
- i certainly don't think a "doge" or "eth" or "sol" or whatever crapcoin treasury company is similar to MSTR. again let's get that out of the way
- but you're basically buying the inevitable DOGE ETF here at something like 15% off, (for now spot can always go lower)
- will keep my finger off the trigger if i focus on my NYSE:FI buy today (now up to 20% size from minuscule y day) and now i'm trading this thing (for fun)
V
7/24/25 - $joby - Lol... gl making money here7/24/25 :: VROCKSTAR :: NYSE:JOBY
Lol... gl making money here
- have long followed the evtol "space" which is a bit more quantum-mechanical in nature... because it "is here" and also "not here"
- will be a long wait here
- somehow retail $ has allowed story tellers to write season after season of "wait and trust me bro" and this is no exception
- perhaps they are a winner
- but this valuation doesn't even require an explanation, sorry (heuristics, and i could get into it if anyone is genuinely curious and not going to just write silly short retorts - happy to debate)
- with that being said this will likely find it's way right back to the single digits, sooner vs later
- welcome to the short portfolio JOBY... you're joined with 10 other small positions that should make you feel like part of the club. i keep em small, so emotion stays ice cold, and when i run em big, i will make a comment. but until then. comfy short here, almost a lobotomized position for a hedge to my long book in this whacky tape
V

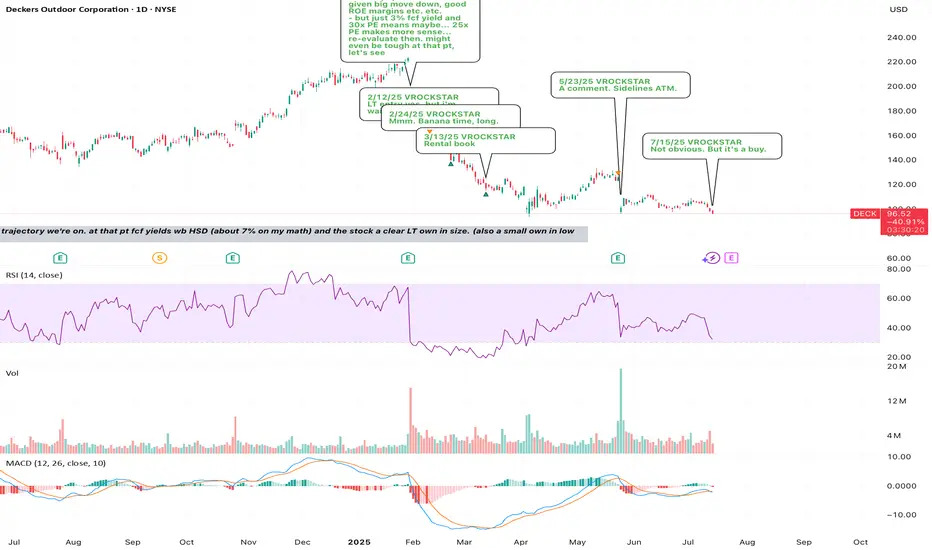
7/15/25 - $deck - Not obvious. But it's a buy.7/15/25 :: VROCKSTAR :: NYSE:DECK
Not obvious. But it's a buy.
- will reiterate that i'm not on tape so closely this week, but will revert w any comment replies by next week; nevertheless i'm checking in here on the tape
- see what T did today on NVDA/ China?
- you think it's easier or harder to resolve some of these discretionary names in the meanwhile vs. nvda H20s to China?
- exactly.
- even NKE put up pretty barfy numbers and the stock was like well... who cares
- i think we're reaching that point with NYSE:DECK here after seeing NYSE:NKE , then reading between the lines on NASDAQ:NVDA ->consumer/discretionary tariffs etc. etc.
- rates will come down, the consumer is tapped out, new fed chair on deck etc. etc.
so the way I'm playing this:
i've bought some ITM calls for aug 15 expiry. why? because it allows me to get proper MSD size (3-4%) but pay only 30-40 bps (10x leverage). the thinking is this... if stock pukes on this result, i'm high conviction that 80% scenario i'd want to load TF up. and if it rips/ or if T has a favorable bowel movement in the meantime... this will rip and off the *extreme* (remember - extreme positioning always gets you the best rewards... but TA doesn't tell you where the bottoms are as much as fundamentals IMVVVHO)... then you get a double whammy and stock is back in the $110s+. so the R/R is v good. but i don't want to get crushed if the stock/ macro work against me and need some wiggle room.
eye'ing LULU too.. but i like valuation and R/R on NYSE:DECK better esp given the NYSE:NKE print and their multiple-brand-multiple-disty strategy vs. say lulu's own-disty strategy.
V
Las Vegas Sands | LVS | Long at $43.76Pros:
Earnings are forecast to grow 13.29% per year
Earnings grew by 18.4% over the past year
2.3% dividend yield
Cons:
Insider selling and exercising of options
Debt-to-equity ratio of 3.8x
Small price gap on the daily chart near $41 that may close prior to a move up.
If people can't buy houses, they will travel... thus, at $43.76, Las Vegas Sands NYSE:LVS is in a personal buy zone.
Targets
$50.00
$57.00
$59.00

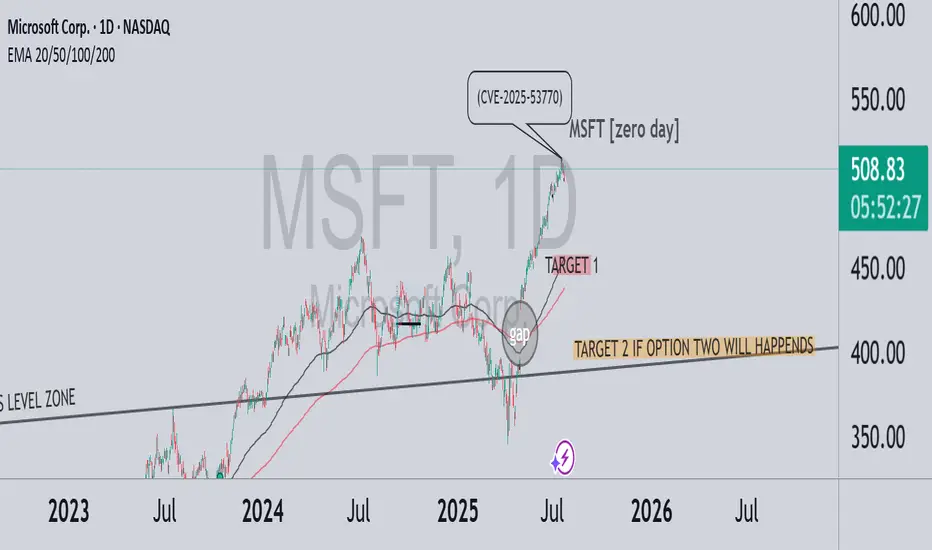
MSFT – A correction brewing? zero day CRWD-like scenario?In July 2025, a critical vulnerability in Microsoft SharePoint (CVE-2025-53770) was exploited by threat actors globally. Although the issue was first reported during the Pwn2Own Berlin competition back in May, Microsoft delayed the patch — allowing attackers a significant head start. Over 400 servers and dozens of organizations were breached, including U.S. and European government entities.
💬 On July 18, Reddit users began discussing the flaw’s severity, comparing it to past vulnerabilities like Log4j. Interestingly, this coincided with the first significant technical deviation from the bullish trend — marking a potential beginning of downside momentum.
🔍 In the chart above:
Strong bullish run until the Zero-Day disclosure
Clear gap beneath current price action
TARGET 1 reflects a natural technical retracement toward EMA 50–100 and the mid-term trendline
TARGET 2 is conditional – it only applies if a massive event occurs, similar to what we saw with CRWD
⚠️ Key distinction:
CrowdStrike: A software update bug caused a global Windows crash — no cyberattack, but massive operational impact
Microsoft: A real, actively exploited security vulnerability — with long-tail risk for data leaks, ransomware, and regulatory backlash
🎯 Conclusion:
If the SharePoint exploit escalates in visibility or consequences, and Microsoft fails to contain the damage — we could see extended downside pressure. TARGET 2 remains valid only under a high-severity scenario, like CRWD’s global meltdown.
$TSLA Bad earnings reactionI was lucky to sell before earnings. Rebuying here. NASDAQ:TSLA had a bad earnings reaction, but otm calls getting bought at the open today 8/8 315c @8.3 for $2 million

META Slows Down For A Correction Within UptrendMeta has seen a strong recovery recently, but barely retested February highs around 740, from where we can see some nice pullback, but it appears corrective, since it’s unfolding in three waves, and forming a potential bull flag — likely wave 4. A breakout above the downward channel on a daily close could signal the start of wave 5 and a push to new highs.
However, keep a close eye on the 666.1; a break below this level would invalidate the bullish view and suggest a deeper consolidation phase may follow.
Highlights:
Direction: Up (pending breakout)
Structure: Wave 4 bull flag; wave 5 possible soon
Support: 680 / 690

Meme stock basket, GPRO, DNUT, OPEN, KSS and BYND, buying dipsbuying the dip in meme stock basket after following criteria reached; trading above or near moving averages and stochastic near oversold levels.

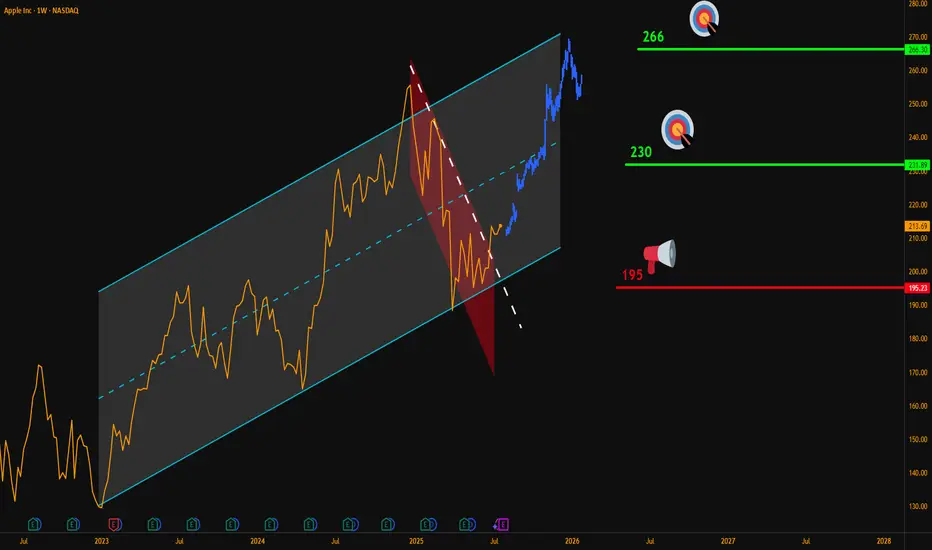
AAPL Weekly Breakout – Targeting $266Hello Traders,
Here’s my latest analysis on Apple (AAPL) based on the weekly chart.
🔍 Chart Breakdown:
Main Uptrend Channel (Blue): Price has respected this channel since 2023.
Red Downtrend Sub-Channel: Recent corrective phase is now broken.
Breakout Signal: Last week, AAPL closed above the sub-channel’s upper line, confirming bullish momentum.
📌 Updated Trade Setup Section:
Entry Zone: Around $215 (current price)
Stop-Loss: Weekly close below $195 (Risk = $20)
Targets:
✅ $230 (Reward = $15 → R:R = 0.75:1)
✅ $266 (Reward = $51 → R:R = 2.55:1)
Always confirm with your own strategy before entering a trade. Position sizing and risk control are key.
💬 Do you think AAPL can reach $266 before Q4 2025? Share your thoughts below!
NASDAQ:AAPL
BUY FINews has given us an opportunity to buy at a good price. Although its below our significant demand level i see this stock turning around.

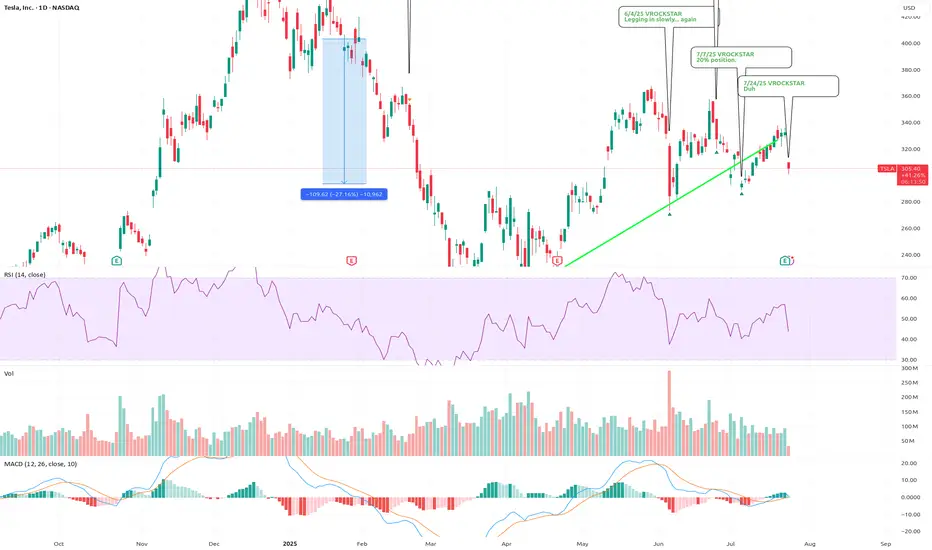
7/24/25 - $tsla - Duh 7/24/25 :: VROCKSTAR :: NASDAQ:TSLA
Duh
- ppl focused on ST FCF (all over X!) is 100% of the reason why when you put the pieces together, you realize that while ST this might not behave like anyone expects... LT, TSLA is v likely going to in, elon's own words, be the largest cap in the history of capital markets
- two leading robots with leadership position in IRL AI
- profitable, is all that matters
- have not yet hit the S-curve
was super lucky to trim some of this last week
now i'm back to sizing into a full position, not yet there like on that silly political dump, but i'm nearly 10% (20% is my max size).
V
7/23/25 - $orly - priced for perfection7/23/25 :: VROCKSTAR :: NASDAQ:ORLY
priced for perfection
- hard to not consider this as a hedge to my NYSE:DECK long (into tmr print)
- stock has had series of weak Q's
- google trends remains meh
- stock not cheap at <3% fcf yield (staples closer to 3.5%+)
- IV on the chain seems lazy... not pricing in much move
- i'd sense that the upside is quite limited and the downside is probably 2-3x the upside
- so while it's not a 9/10 idea (like the push i made on say BOATS:FI after the open this morning - which worked very well and now back to a comfy spot w ITM leaps)... it's a nice filler position on the hedge side, i think
- and honestly it's also a situation where we flip the river card and the stock rips on mediocre restuls... and that tired stock chart just wants to flip bearish, even if it's just a temporary pause before heading higher
- i look at this and i know the personalities that own it
- i'll take under, fam
V
