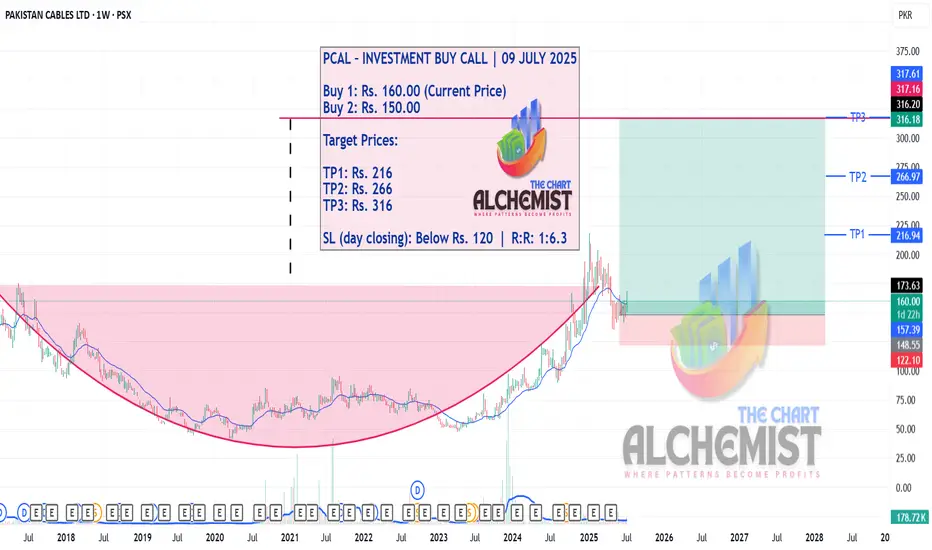
PCAL – INVESTMENT BUY CALL | 09 JULY 2025PCAL – INVESTMENT BUY CALL | 09 JULY 2025
Pakistan Cables Limited (PCAL) has completed a rare 7-year farming and scale-up formation. A major breakout occurred in December 2024, followed by a sharp rally to Rs. 218. The recent pullback appears structurally complete, and the stock is now poised for a major upward move with long-term potential.
📌 Execution Strategy:
Caution: Please buy in 2–3 parts within the buying range. Close at least 50% of your position at TP1 and trail the stop loss to protect gains as the trend develops.
📢 Disclaimer: Do not copy or redistribute signals without prior consent or proper credit to The Chart Alchemist (TCA).
✨ Kindly support our efforts by boosting and sharing this idea!
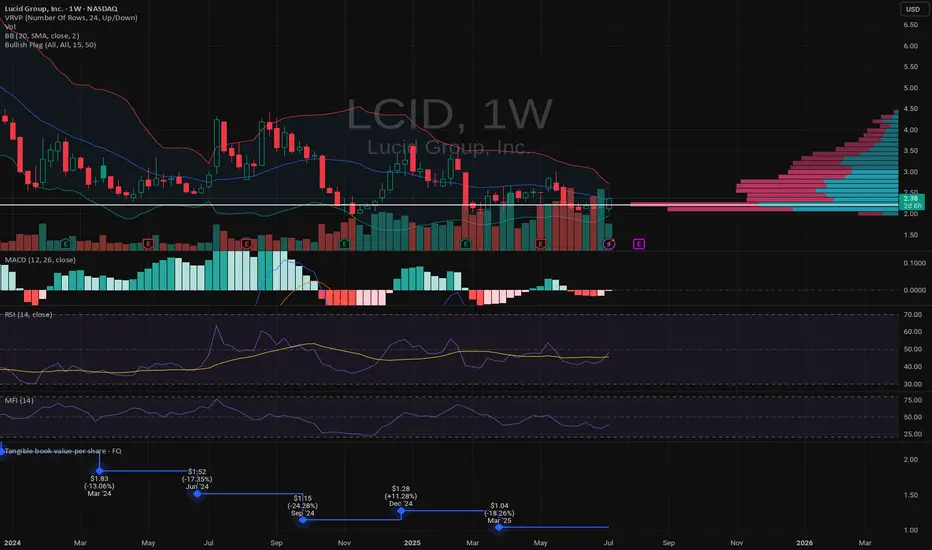
LCID - LONGLCID
LONG
Tight BB building pressure. Lots of other squeezes happening and this is no exception.
not trading advice.
Safe Entry Zone CMPSStock Recovering from steep drop from bad news (which we don't care).
Blue Zone is Sell Zone.
Green Zone is Buy Zone.
since stock already rallied. its Risky to follow we wait price to re-test Green Zone.
Also My Beloved CAthie Wood BEST INVESTOR All Time (based on statics better than Warren Buffet Entire Histroy) Is BUYING!
Note: 1- Potentional of Strong Buying Zone:
We have two scenarios must happen at The Mentioned Zone:
Scenarios One: strong buying volume with reversal Candle.
Scenarios Two: Fake Break-Out of The Buying Zone.
Both indicate buyers stepping in strongly. NEVER Join in unless one showed up.
2- How to Buy Stock:
On 1H TF when Marubozu/Doji Candle show up which indicate strong buyers stepping-in.
Buy on 0.5 Fibo Level of the Marubozu/Doji Candle, because price will always and always re-test the
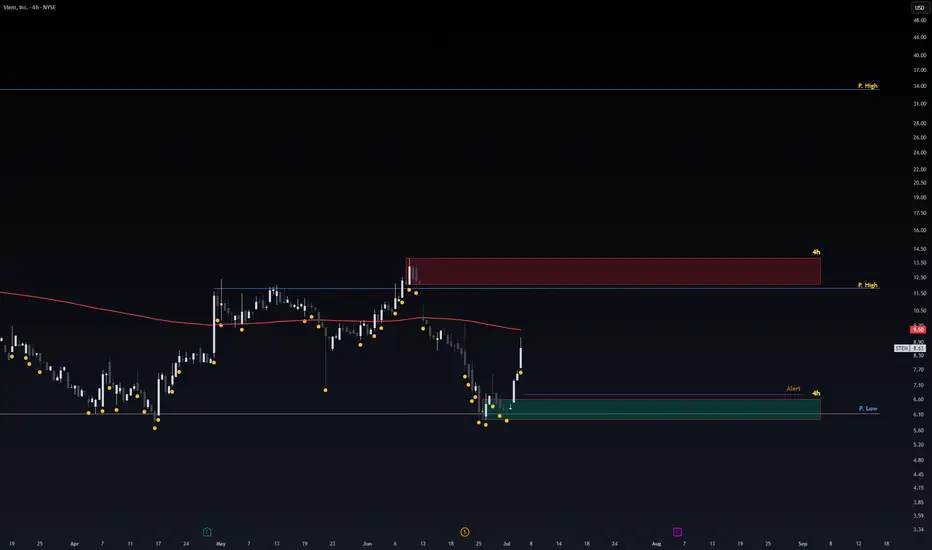
Safe Entry STEMPrice movement consolidating.
Safe Entry Green Zone.
Red Zone is Sell Zone. better watch out for any selling pressure.
P.high Lines Are Good Resitances.
Final Target 33.45$ price level.
better to wait stock and not follow.
Note: 1- Potentional of Strong Buying Zone:
We have two scenarios must happen at The Mentioned Zone:
Scenarios One: strong buying volume with reversal Candle.
Scenarios Two: Fake Break-Out of The Buying Zone.
Both indicate buyers stepping in strongly. NEVER Join in unless one showed up.
2- How to Buy Stock:
On 1H TF when Marubozu/Doji Candle show up which indicate strong buyers stepping-in.
Buy on 0.5 Fibo Level of the Marubozu/Doji Candle, because price will always and always re-test the
Safe Entry CNSNote: Lower TF to 1h or 4h to see better details.
Recently Trump lift chips design prohibition to be sent to china. (Positive to CDNS)
Stock Obvious and clearly at major resistance with such news it expected to open Gap Up.
following the stock would be mistake unless stock open in pre-market with price level similar to close.
better to wait stock to open gap up. Re-test the major resistance.
that would be major support level and safe entry for price to go higher.
Note: 1- Potentional of Strong Buying Zone:
We have two scenarios must happen at The Mentioned Zone:
Scenarios One: strong buying volume with reversal Candle.
Scenarios Two: Fake Break-Out of The Buying Zone.
Both indicate buyers stepping in strongly. NEVER Join in unless one showed up.
2- How to Buy Stock:
On 1H TF when Marubozu/Doji Candle show up which indicate strong buyers stepping-in.
Buy on 0.5 Fibo Level of the Marubozu/Doji Candle, because price will always and always re-test the

Safe Entry OracleStock In Up-Movement.
P.High (Previous High) is Safe Entry.
Note: 1- Potentional of Strong Buying Zone:
We have two scenarios must happen at The Mentioned Zone:
Scenarios One: strong buying volume with reversal Candle.
Scenarios Two: Fake Break-Out of The Buying Zone.
Both indicate buyers stepping in strongly. NEVER Join in unless one showed up.
2- How to Buy Stock (safe way):
On 1H TF when Marubozu/Doji Candle show up which indicate strong buyers stepping-in.
Buy on 0.5 Fibo Level of the Marubozu/Doji Candle, because price will always and always re-test the

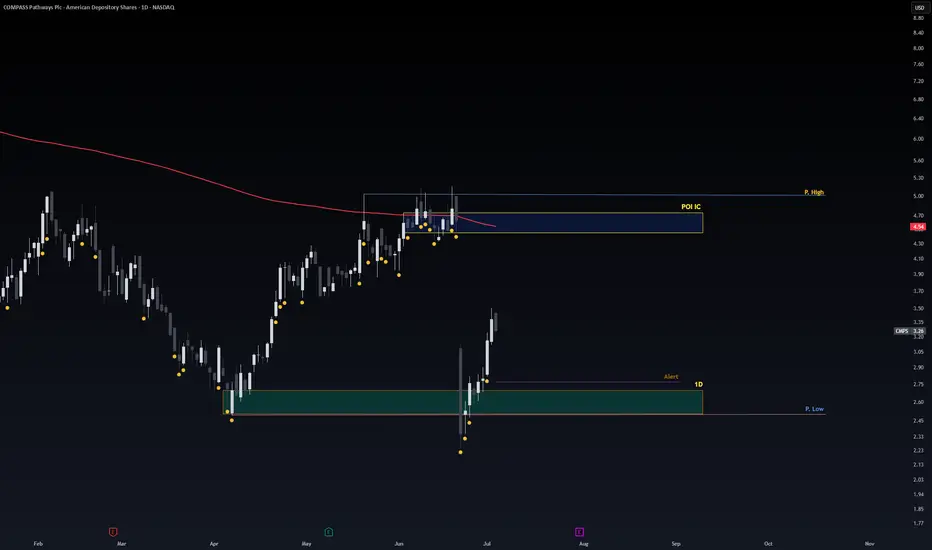
Safe Entry Zone CHWYCurrently stock in Ranging Movement.
1h Green Zone is buying Zone.
1h Red Zone is selling Zone.
Price ranging with strong potional of Strong Up-Movement.
Note: 1- Potentional of Strong Buying Zone:
We have two scenarios must happen at The Mentioned Zone:
Scenarios One: strong buying volume with reversal Candle.
Scenarios Two: Fake Break-Out of The Buying Zone.
Both indicate buyers stepping in strongly. NEVER Join in unless one showed up.
2- How to Buy Stock:
On 1H TF when Marubozu/PinBar Candle show up which indicate strong buyers stepping-in.
Buy on 0.5 Fibo Level of the Marubozu Candle, because price will always and always re-test the imbalance.

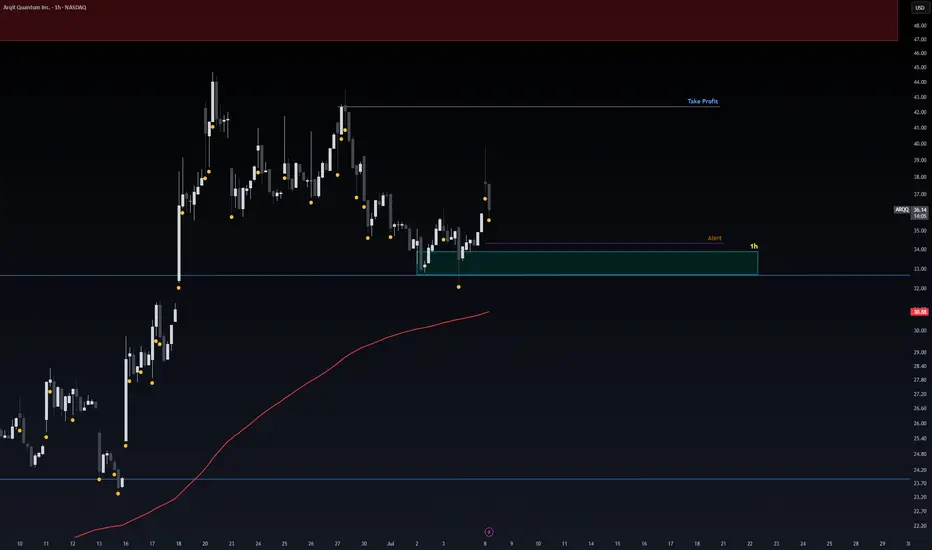
Safe Entry Zone ARQQStock in Up Movement.
1H Green Zone is Safe Entry.
Note: 1- Potentional of Strong Buying Zone:
We have two scenarios must happen at The Mentioned Zone:
Scenarios One: strong buying volume with reversal Candle.
Scenarios Two: Fake Break-Out of The Buying Zone.
Both indicate buyers stepping in strongly. NEVER Join in unless one showed up.
2- How to Buy Stock (safe way):
On 1H TF when Marubozu/Doji Candle show up which indicate strong buyers stepping-in.
Buy on 0.5 Fibo Level of the Marubozu/Doji Candle, because price will always and always re-test the
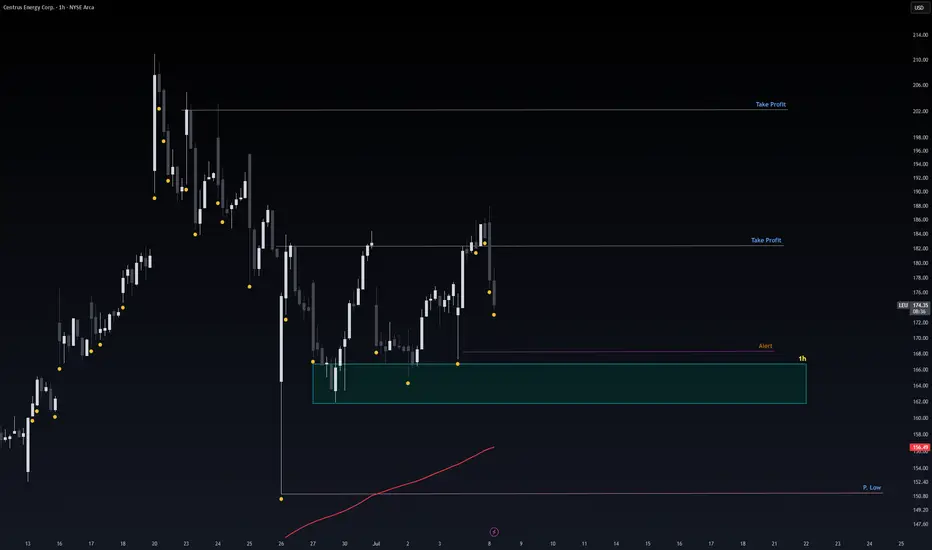
Safe Entry LEUStock Movement Ranging.
Current 1H Green Zone is Safe Entry, wait for confirmation for entry since the Zone been Tested before which means its weaker but since it has strong buying power i believe its safe.
Note: 1- Potentional of Strong Buying Zone:
We have two scenarios must happen at The Mentioned Zone:
Scenarios One: strong buying volume with reversal Candle.
Scenarios Two: Fake Break-Out of The Buying Zone.
Both indicate buyers stepping in strongly. NEVER Join in unless one showed up.
2- How to Buy Stock (safe way):
On 1H TF when Marubozu/Doji Candle show up which indicate strong buyers stepping-in.
Buy on 0.5 Fibo Level of the Marubozu/Doji Candle, because price will always and always re-test the
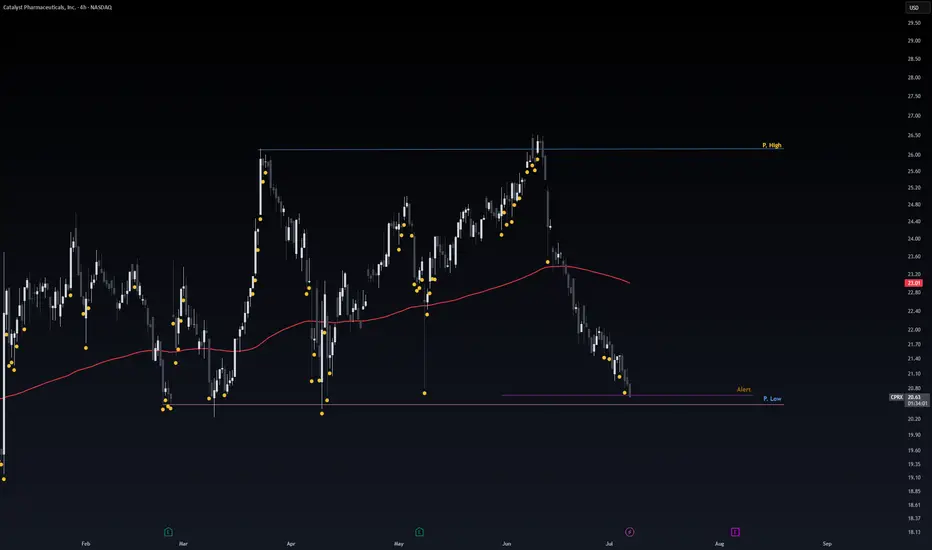
Safe Entry CPRXStock Movement Ranging.
Currently at Support level.
P.Low Zone is Buy Zone.
Target P.High Zone is Sell Zone.
Note: 1- Potentional of Strong Buying Zone:
We have two scenarios must happen at The Mentioned Zone:
Scenarios One: strong buying volume with reversal Candle.
Scenarios Two: Fake Break-Out of The Buying Zone.
Both indicate buyers stepping in strongly. NEVER Join in unless one showed up.
2- How to Buy Stock (safe way):
On 1H TF when Marubozu/Doji Candle show up which indicate strong buyers stepping-in.
Buy on 0.5 Fibo Level of the Marubozu/Doji Candle, because price will always and always re-test the
$MET u again - Bullish StanceNYSE:MET 's chart reveals classic rally-base-rally structure: strong uptrend channel (green), consolidation phase at $80-85, sharp April selloff to $68 creating new base, now rallying from this foundation.
Current price ($79.79) testing previous support-turned-resistance. Watch for breakout above $80 to confirm pattern completion. #TechnicalAnalysis #RBR

Short term (GOOG) shortCaught it on the fib pull back. Very short term trade as overall market trend is bullish.

SONATASOFTWARE techno-funda analysisSonata Software Ltd. is a global IT services and solutions company focused on digital transformation, cloud enablement, and platform modernization. It caters to sectors like retail, BFSI, travel, and manufacturing, with deep capabilities in Microsoft ecosystem technologies. The stock is currently trading at ₹509.35 and is forming a base after a broad retracement from previous highs.
Sonata Software Ltd. – FY22–FY25 Snapshot
Sales – ₹5,372 Cr → ₹6,214 Cr → ₹7,465 Cr → ₹8,155 Cr – Consistent revenue expansion led by digital and cloud
Net Profit – ₹410 Cr → ₹487 Cr → ₹548 Cr → ₹618 Cr – Margin stability despite macro cost pressures
Company Order Book – Moderate → Moderate → Strong → Strong – Strong deal pipeline in U.S. and Europe Dividend Yield (%) – 1.23% → 1.31% → 1.40% → 1.40% – Fair yield, supports total shareholder return
Operating Performance – Moderate → Moderate → Strong → Strong – Cloud and IP-led growth improving
Equity Capital – ₹140.23 Cr (constant) – Efficient capital structure
Total Debt – ₹195 Cr → ₹180 Cr → ₹165 Cr → ₹155 Cr – Low and declining, comfortable leverage
Total Liabilities – ₹2,030 Cr → ₹2,150 Cr → ₹2,270 Cr → ₹2,385 Cr – Growing with operating scale
Fixed Assets – ₹465 Cr → ₹480 Cr → ₹505 Cr → ₹528 Cr – Gradual tech and infra investment
Latest Highlights
FY25 net profit rose 12.8% YoY to ₹618 Cr; revenue up 9.2% to ₹8,155 Cr
EPS: ₹44.07 | EBITDA Margin: 17.4% | Net Margin: 7.58%
Return on Equity: 21.79% | Return on Assets: 10.96%
Promoter holding: 34.55% | Dividend Yield: 1.40%
Strong performance in cloud migration, managed services, and proprietary platform IPs
North America remains key growth driver, with robust enterprise digital transformation budgets
Technical Snapshot Sonata Software is trading at ₹509.35 with an RSI of 44.70, signaling neutral to mildly bearish sentiment. After correcting from the recent top, the stock has found support around ₹509.35 and earlier at ₹424.15 and ₹366.45. Price is coiling near the base of a structural channel with rebound potential. If sentiment turns, bullish retracement targets lie at ₹787.00, ₹923.05, and ₹1,096.40 in the medium term.
Business Growth Verdict Yes, Sonata Software is scaling steadily with a solid IP-led tech strategy
Margins are stable with strong ROE and limited debt exposure
Order book strength and platform-led solutions support future visibility
Capex and infra investments remain conservative and purposeful
Final Investment Verdict Sonata Software offers a mature growth narrative in the mid-cap IT services space. Its differentiated approach in digital engineering, Microsoft partnerships, and repeat global clientele provide high revenue stickiness. While broader IT demand is moderating, Sonata’s platform-led margin resilience and capital discipline stand out. The current technical base and improving order visibility make it a strong candidate for medium-term accumulation with a focus on operational consistency and yield support.

FTNCOCOA FTN Cocoa Processors PlcFTN Cocoa Processors Plc price action just formed an inverse head and shoulders pattern.
Current price: 2.00 (at Neckline Resistance)
Investment buy reasons:
1. Notable higher highs created from 0.94 to 1.47
2. Current price is a low risk buy, as price action has retraced over 50% from all time high of 4.1
Profit taking areas if price action breaks neckline resistance: 2.97, 3.96
Note: This Analysis invalidates below. 1.47
Disclaimer:
This is for educational purposes only and does not constitute financial or investment advice. Always do your own research and consult with a professional before making any investment decisions.

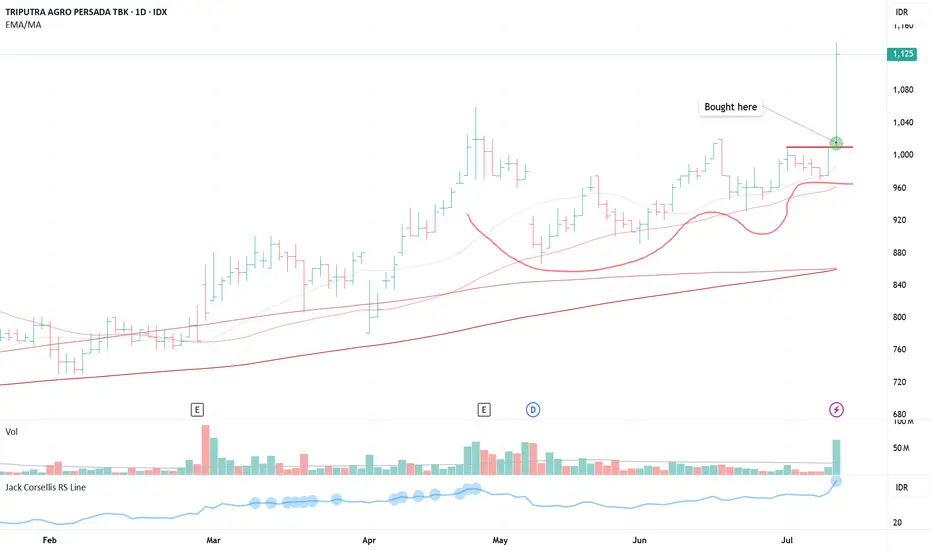
TAPG (VCP 10W 18/4 3T)Position update: July 9, 2025.
Key factors:
1. Confirmed stage 2 uptrend.
2. A textbook VCP setup with a clear, low-risk entry
3. Has absorbed its majority line of supply.
4. The stock moves on its own drummer, hitting an all-time high while the index struggles to reclaim its highs.
5. High relative strength.
6. Volume has dried up, indicating less supply coming to the market.
7. Strong fundamentals, with consistent triple-digit year-over-year earnings growth.
8. Significant volume surge on the breakout.
Considerations: Despite a favorable technical setup, risk should be managed diligently given the stock's sharp ascent and potential for profit-taking. Establishing stop-loss levels and monitoring market conditions is essential.
This is a quintessential VCP breakout with a clear pivot entry and minimal risk. I’m starting to see increased traction in the market now—a very positive sign to scale up trading size.
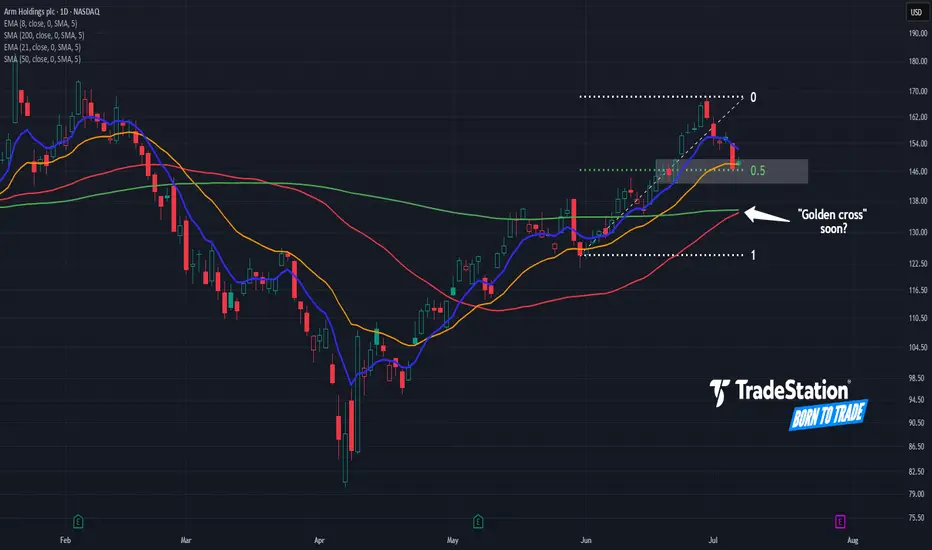
Arm Pulls BackArm Holdings rallied sharply last month, and now the AI chip stock has pulled back.
The first pattern on today’s chart is the advance from May 30 through June 30. ARM retraced half that move and is trying to bounce, which may confirm its upward direction.
Second, prices have retested their rising 21-day exponential moving average (EMA). The 8-day EMA is also above the 21-day EMA. Those signals may be consistent with short-term bullishness.
Third, the 50-day simple moving average (SMA) is nearing a potential “golden cross” above the 200-day SMA. That could reflect longer-term bullishness.
Finally, a four-session consolidation zone formed in late June between roughly $143 and $149. Will it now emerge as new support?
Check out TradingView's The Leap competition sponsored by TradeStation.
TradeStation has, for decades, advanced the trading industry, providing access to stocks, options and futures. If you're born to trade, we could be for you. See our Overview for more.
Past performance, whether actual or indicated by historical tests of strategies, is no guarantee of future performance or success. There is a possibility that you may sustain a loss equal to or greater than your entire investment regardless of which asset class you trade (equities, options or futures); therefore, you should not invest or risk money that you cannot afford to lose. Online trading is not suitable for all investors. View the document titled Characteristics and Risks of Standardized Options at www.TradeStation.com . Before trading any asset class, customers must read the relevant risk disclosure statements on www.TradeStation.com . System access and trade placement and execution may be delayed or fail due to market volatility and volume, quote delays, system and software errors, Internet traffic, outages and other factors.
Securities and futures trading is offered to self-directed customers by TradeStation Securities, Inc., a broker-dealer registered with the Securities and Exchange Commission and a futures commission merchant licensed with the Commodity Futures Trading Commission). TradeStation Securities is a member of the Financial Industry Regulatory Authority, the National Futures Association, and a number of exchanges.
TradeStation Securities, Inc. and TradeStation Technologies, Inc. are each wholly owned subsidiaries of TradeStation Group, Inc., both operating, and providing products and services, under the TradeStation brand and trademark. When applying for, or purchasing, accounts, subscriptions, products and services, it is important that you know which company you will be dealing with. Visit www.TradeStation.com for further important information explaining what this means.
Quick View: $SLB- Great consolidaiton on the daily with EMAs+Price ready to make THE Move.
- The hourly looks good with a perfect box

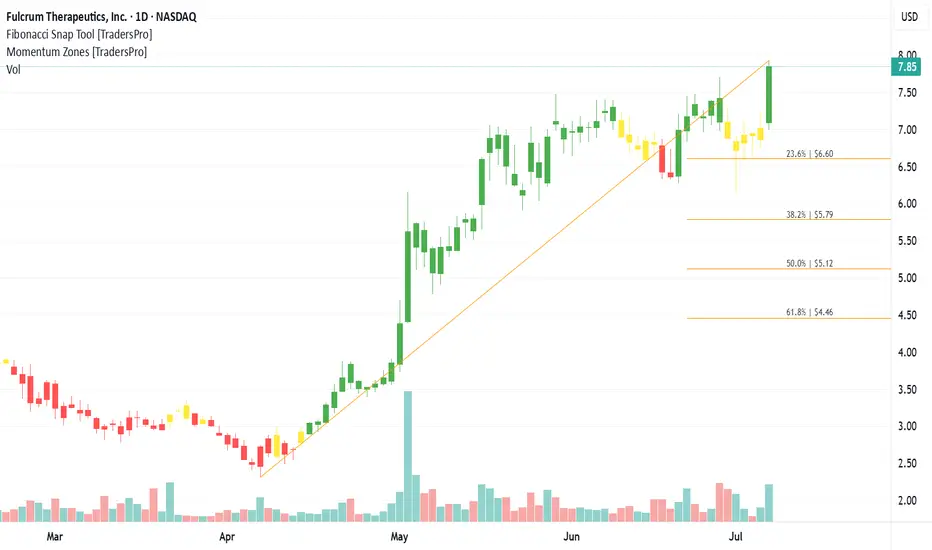
Fulcrum Therapeutics, Inc. (FULC) Targets Rare DiseaseFulcrum Therapeutics, Inc. (FULC) is a clinical-stage biopharmaceutical company focused on developing small-molecule therapies to treat genetically defined diseases. Its lead candidate, losmapimod, is being developed for facioscapulohumeral muscular dystrophy (FSHD), a rare and debilitating muscle disorder. Fulcrum’s growth is driven by advancing clinical trials, expanding its drug pipeline, and the growing interest in precision medicine targeting genetic conditions.
On the chart, a confirmation bar with rising volume indicates strong buying interest. The price has entered the momentum zone by moving above the .236 Fibonacci level. A trailing stop can be placed just below this level using the Fibonacci snap tool to protect profits while leaving room for further gains.
AXIS BANK at Best Support !!This is the 1 hour chart of AXIS BANK .
Axis bank having a good law of polarity at 1200 level.
Axisbank is moving in well defined parallel channel with support range 1160-1180 .
If this level is sustain , then we may see higher prices in AXISBANK.

HINDUSTAN ZINC LTD at Best Support !!There are two charts of Hindustan Zinc — one on the 4-hour time frame, and the second on weekly time frame.
Chart 1 (4-Hour Timeframe):
The stock is moving in a Higher High, Higher Low (HH-HL) structure, indicating a bullish trend.
Support zone is observed near the 400–410 range.
Chart 2 (Weekly Timeframe):
On the weekly chart:
the stock is approaching a major support zone in the range of ₹375 – ₹390, which has historically held strong.
If this level is sustain then we may see higher prices in HINDZINC.
Thank You !!

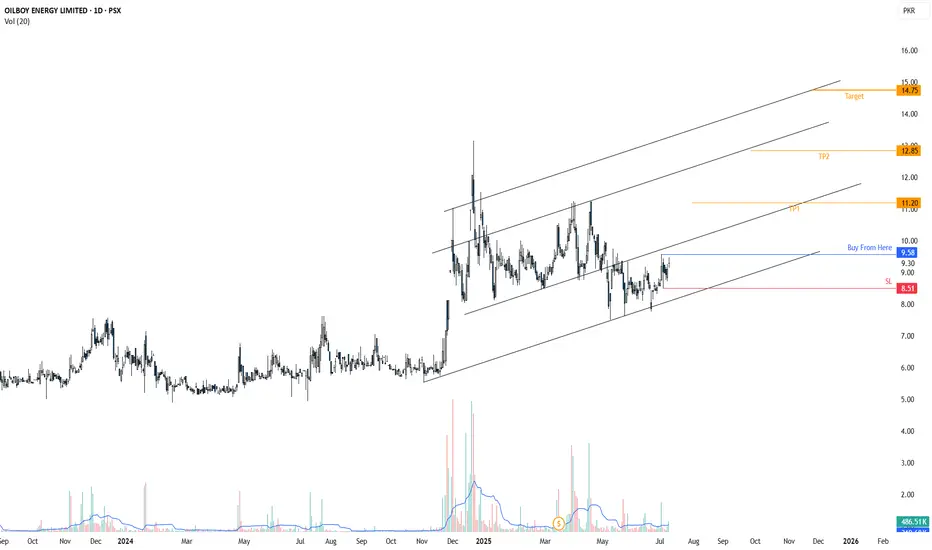
OBOY is in Rising ChannelOBOY is in Rising Channel, it has already taken retracement from golden zone