$PEP Bullish Swing Setup – Oversold & Ready to Rebound ?PepsiCo ( NASDAQ:PEP ) is sitting at a major long-term support after a deep pullback — this could be a strong opportunity for a risk-defined bounce. Here's what the chart is signaling:
🔹 Entry Zone: Price is currently near $128 — a historically significant level that acted as resistance in the past and now aligns with a potential support flip.
🔹 Oversold & Stretched: After a consistent downtrend, NASDAQ:PEP is looking oversold. A bounce is likely as sellers exhaust and dip buyers return at this key level.
🔹 Reversal Structure Building: Early signs of a bottoming pattern are emerging, with potential higher lows forming. If the current structure holds, we could see a climb toward the next resistance zones.
🎯 Targets:
TP1: $154 – minor resistance and previous consolidation zone.
TP2: $197 – major resistance and range high, aligning with earlier highs.
🛡️ Stop Loss: Below $102 — invalidates the support thesis and breaks structure.
💡 Why Price May Rise:
PEP is a defensive name with strong fundamentals, often benefiting during uncertain macro cycles.
Valuation is now more attractive after the sell-off.
The setup offers a high reward-to-risk ratio, especially if broader markets stabilize.
⚖️ Setup Summary:
Entry: ~$128
SL: $102
TP1: $154
TP2: $197
📌 Watching for confirmation with volume or bullish candle structure over the next few sessions.
🚫 Not financial advice — just a technical outlook based on structure and probability.

BAJAJ AUTO LTD – Trendline Breakout with Upside Potential NSE:BAJAJ_AUTO – Trendline Breakout (The setup offers a favorable risk-reward ratio, with potential for ~500+ points upside from the breakout zone.)
Chart Type: Daily (1D)
Current Price: ₹8,455
Structure: Falling wedge breakout with defined targets
Falling Wedge Formation:
The price has been consolidating within a falling wedge pattern, indicating a potential bullish reversal.
Both upper and lower trendlines (labeled as "small down trend") have been respected multiple times, validating the structure.
Breakout Confirmation:
A breakout above the descending trendline has occurred, accompanied by a bullish candle closing above the immediate resistance zone around ₹8,407.
This marks the breakout point and indicates a shift in momentum.
Support Zone:
Strong support has been established near ₹8,225.55, as marked on the chart.
This level can serve as a stop-loss for bullish positions.
-----
BUY: above 8410-8450
SUPPORT ( SL ) : 8220
RESISTANCE ( TGT) :8640-8780-9000+++

$LLY Technical Setup – Breakout ReloadingNYSE:LLY is holding a critical mid-range level, and the chart hints at a potential accumulation before a breakout. Here's the updated view:
🔹 Horizontal Range Still Intact: Price remains trapped between ~$710 support and ~$965 resistance. These levels have acted as major turning points for over a year — creating a defined trading range.
🔹 False Breakdown & Quick Recovery: After dipping below support, price quickly reclaimed the $795 level — often a signal of seller exhaustion and demand stepping in. This creates a potential bear trap scenario.
🔹 Rejection Zones Marked: Prior attempts to break above ~$965 have failed at the same zone (highlighted in blue), forming a strong but vulnerable ceiling. Each attempt weakens the resistance.
🔹 Current Structure Suggests Stair-Step Higher:
Holding $795 could attract more buyers.
A higher low formation would build pressure for a push toward the top of the range.
Break and hold above $965 opens the door to ATH continuation.
🔹 Trade View:
Entry: ~$790–$800 zone
Stop: Below $709 (red zone — invalidation level)
Target: $965, possibly higher if breakout confirms
💡 Why Price Could Rise:
Price just reclaimed a key level that previously acted as a major pivot.
Strong pharma sector sentiment and NYSE:LLY 's leadership in the GLP-1 space remain intact.
Technical structure supports continuation of the larger range cycle.
🚫 Not financial advice — just charting the probabilities. Watch for confirmation!

A BNPL Bubble Is Actually Why I'm Bullish, For NowBNPL is growing and inflating at an increasing rate. From concert tickets to burritos, everyone is using buy now pay later. The global market is projected to hit 560 billion dollars in 2025, up from around 492 billion in 2024, and climb to 912 billion by 2030 at a compounding growth rate of 10.2%. Just in the U.S. alone, demand is expected to reach 122 billion next year and scale to 184 billion by the end of the decade. The trajectory is steep, with the structural weaknesses already showing.
Block is positioned at the center of BNPL. In Q1 2025 they reported:
2.29 billion in gross profit, up 9 percent YoY
466 million in adjusted operating income, up 28%
10.3 billion in GMV through Afterpay, with 298 million in BNPL gross profit, up 23% YoY
The stock took a hit. It dropped 9 percent in February and another 21 percent after missing Q1 earnings, but this is seen as typical early bubble behavior. There is short term fear but continuing growth and acceleration. Klarna’s credit losses, IPO delays, and regulatory friction are not problems, they are actually signals that the sector is growing faster than the market, or quite frankly, anyone can control.
BNPL is becoming the default credit system for younger consumers. It is overused and expanding too fast. That is the formula for both upside and implosion. However with that, timing will be everything here, and knowing when to close will be crucial if BNPL can't stabilize.
Baseline expectation: SQ trades in the 80 to 90 range in the short term
Midterm upside: 120 by 2027
Long-term target: 180 to 220 if BNPL stabilizes and Block captures its runway

Quick View: $ABNBWhile the daily chart is still bullish, the hourly chart saw a pullback with a recent breakout of a consolidation area. Supported by a bullish crossover.

Quick View: $TROW- The daily chart sees a bullish crossover with a consolidation area. A Break above with a new relative high will lead the price higher

MOIL - Potential for 500 target with Crown pattern in makingMOIL has confirmation for Bullish crown formation .
It has closed above 20 & 50 EMA on day time frame.
Moreover MACD is signal line has turned positive.
With all this it has potential for following targets;
360 / 400 / 450 / 500
SL: 315

LLOYDSME - The dark knight in metals?Nifty Metals is a severely overlooked space right now. To outperform the majority of participants you need to look outside the box.
Since then, there have been continuous news flow and reasons why markets have been volatile, but this stock has silently stood strong. This is sign of Institutional accumulation. The Risk Reward on offer here is excellent. Over the long term it can be a multi-bagger as well.
Keep your risk in check, stock is at ATH so scale in should be in appropriate manner, I will keep updating as and when the structure develops.

Breakout after inverted head & shoulder BAJAJHIND EquityBreakout after inverted head & shoulder BAJAJHIND Equity, with high volume.

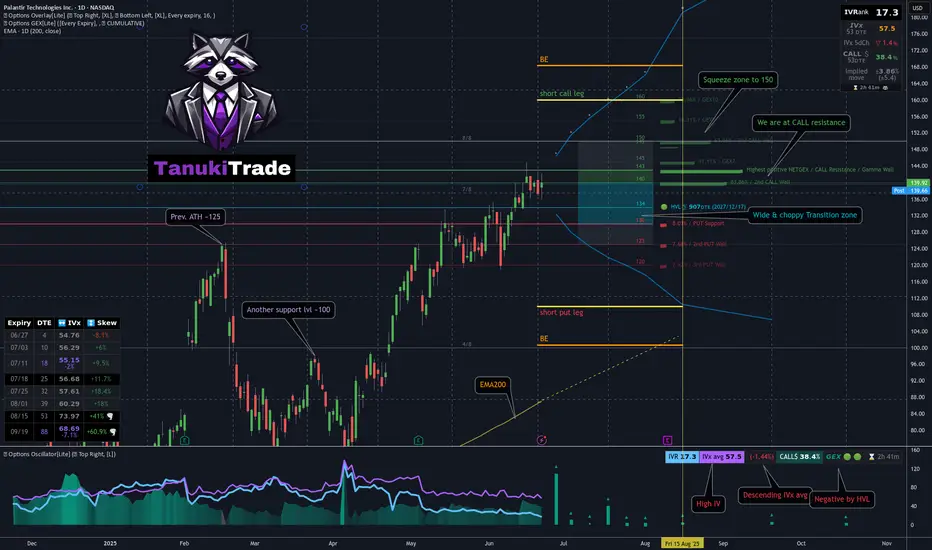
Jade Lizard on PLTR - My 53DTE Summer Theta PlayMany of you — and yes, I see you in my DMs 😄 — are trading PLTR, whether using LEAPS, wheeling, or covered calls.
I took a closer look. And guess what?
📈 After a strong move higher, PLTR was rejected right at the $143 call wall — pretty much all cumulative expiries cluster resistance there
Using the GEX Profile indicator, scanning all expirations:
After a brief dip, the market is repositioning bullish
Squeeze zone extends up to 150
The most distant GEX level is sitting at 160
On the downside, 130 is firm support, with some presence even at 120 — the market isn’t pricing in much risk below that
📉 From a technical standpoint:
We’re near all-time highs
125 (previous ATH) and 100 are key support levels
The OTM delta curve through August is wide, and the call side is paying well — with a current call pricing skew
🔬 IVx is at 57, trending lower + call pricing skew📉 IV Rank isn't particularly high, but the directional IVx matters more here
💡 Summer Theta Play: Jade Lizard on PLTR
Since I’ll be traveling this summer and don’t want to micromanage trades, I looked for something low-touch and high-confidence — and revisited an old favorite: the Jade Lizard.
If you're not familiar with the strategy, I recommend checking out Tastytrade's links and videos on Jade Lizards.
🔹 Why this setup?
Breakeven sits near $100, even with no management
On TastyTrade margin:~$1800 initial margin ~$830 max profit
53 DTE — plenty of time for theta to work
Earnings hit in August — I plan to close before then
Covers all bullish GEX resistance zones
Quickly turns profitable if IV doesn’t spike
Highly adjustable if needed
My conclusion: this strategy covers a much broader range than what the current GEX Profile shows across all expirations — so by my standards, I consider this to be a relatively lower-risk setup compared to most other symbols right now with similar theta strategies.
🔧 How would I adjust if needed?
If price moves up:
I’d roll the short put up to collect additional credit
Hold the call vertical as long as the curve supports it
If price drops:
Transition into a put ratio spread
Either extend or remove the call vertical depending on conditions
🛑 What’s the cut loss plan?
I have about 20% wiggle room on the upside, so I’m not too worried — but if price rips through 160 quickly, I’ll have to consider early closure.
If that happens, the decision depends on time:
If late in the cycle with low DTE:→ Take a small loss & roll out to next month for credit
If early with lots of DTE remaining:→ Consider converting to a butterfly, pushing out the call vertical for a small debit→ Offset this with credit from rolling the put upward
As always — stay sharp, manage your risk, and may the profit be with you.
See you next week!– Greg @ TanukiTrade
DLO about to break the downward triangleDLO about to break the downward triangle and have hold above 200 day MA NASDAQ:DLO

DHER: higher low higher high ?most likely next jump (53 region) ahead. most undervalued stock in europe and a long term buy

GRAB — Breakout Confirmation and Strong Upside PotentialGrab Holdings (GRAB) is currently forming a promising technical setup supported by a breakout from long-term consolidation. After printing a strong low and breaking out of a multi-year range, the price action confirms a bullish reversal with clear structure.
Technical Analysis
– Trendline breakout and bullish market structure shift
– Price is consolidating above the breakout level, forming a continuation zone
– Valid entries: market execution above $4.50 or limit orders near $4.00 support
– First profit target: $6.60 (around 40% growth)
– Second target: $10.15 (over 100% from entry)
The setup suggests increasing bullish momentum. A clean consolidation above previous resistance strengthens the case for a breakout continuation toward $6.60 and potentially $10.15.
Fundamental Backdrop
Grab is a Southeast Asian tech leader operating across ride-hailing, food delivery, and digital payments. The company continues to reduce losses, improve margins, and expand its fintech arm. With rising digital adoption in the region and a shift toward profitability, GRAB is gaining investor attention. Its most recent earnings report showed improving revenue trends and narrowing net losses — a strong signal of long-term sustainability.
Conclusion
Grab Holdings presents a well-aligned opportunity from both a technical and fundamental perspective. With a clear structure, breakout confirmation, and fundamental turnaround, this setup fits both swing and midterm investment strategies. Risk management is still key — stops should be placed below consolidation lows or key structure levels.

AMZN: Daily Trend Change with Bullish Continuation Setup
🗓 Published: June 26, 2025
📍 Ticker: NASDAQ:AMZN – Amazon.com Inc.
🕒 Timeframes: Daily & 4H
📊 Technical Bias: Bullish
📈 Trend: Higher Highs & Higher Lows
🧠 Analysis Summary
Amazon has successfully reclaimed a bullish market structure on the daily chart by forming higher highs and higher lows since late April. Price is now retesting a key support zone around $209–$212, which aligns with both horizontal support and the rising trendline.
On the 4H chart, the price is stabilizing near the trendline support, offering a high-probability long entry setup if the current structure holds.
📍 Key Levels
Price Level Description
206.28–206.42 Key support zone (invalidation area)
209.06 Local demand area
212.06 Retest level, potential entry
214.76 Local high / minor resistance
219.92 Intermediate target zone
225.22–225.29 Main bullish target / resistance
✅ Trade Setup
Entry Zone:
🔵 Long between $209.00 – $212.00 on confirmation of support
Take Profit Targets:
TP1: $214.76
TP2: $219.92
TP3: $225.22–225.29
Stop Loss:
🔴 Below $206.00 (break of structure + trendline invalidation)
Risk:Reward Potential: ~1:2.5
🔍 Confluence Factors
Daily trendline acting as dynamic support
Demand zone overlap at $209
Volume spike near base, suggesting buyer interest
Higher low formation + potential breakout of local range
⚠️ Risk Note
Only valid if price holds the $209–$212 demand area. If $206.00 is broken with strong bearish candles, the long setup is invalidated and a reassessment is required.
💬 Do you think AMZN will reclaim $225 by earnings? Let me know your outlook!
🚀 Stay patient, follow price structure, and manage your risk properly.
Rendon1

"AIRBNB: The Market’s Next BIG Move – Are You In or Out?"🚨 AIRBNB HEIST ALERT: Bullish Loot Grab Before the Escape! (Swing/Day Trade Plan) 🚨
🌟 Attention Market Pirates & Profit Raiders! 🌟
🔥 THIEF TRADING STYLE STRATEGY – AIRBNB (ABNB) LOOTING ZONE! 🔥
📌 THE HEIST PLAN:
Based on high-risk, high-reward technical & fundamental analysis, we’re eyeing a bullish heist on AIRBNB, INC. The market is in consolidation, overbought, but primed for a potential breakout or reversal trap. Bears are lurking, but we’re stealing the treasure first!
🔐 ENTRY: "VAULT IS OPEN!"
Buy Limit Orders (15-30 min timeframe) near key levels.
Scalpers: Only play LONG—fast in, fast out!
Swing Traders: Load up & trail for bigger gains.
ALERT SETUP HIGHLY RECOMMENDED!
🛑 STOP LOSS (SL): "DON’T GET CAUGHT!"
Nearest Swing Low (3H TF) @ 125.00 (adjust based on risk & position size).
Trailing SL = Best escape route for scalpers!
🎯 TARGET: "ESCAPE WITH THE LOOT!"
🎯 150.00 (or exit early if momentum fades).
Risk Warning: High volatility—trade smart!
📡 STAY ALERT:
News & Macro Risks: Avoid new trades during high-impact events.
Lock profits with Trailing SL!
💥 BOOST THIS IDEA IF YOU LOVE THE HEIST!
More lucrative robbery plans coming soon—stay tuned, pirates! 🏴☠️💰🔥
🚀 LIKE, SHARE, & FOLLOW FOR NEXT HEIST!

Weekly supply As it is a weekly supply zone it may achieve the target in a month but sticy stop loss is compulsory

Demand zone buyFor 1 hour time frame target may achieved within one week but proper stoploss to be maintained
GH (Guardant Health) — Breakout Setup with Strong Upside PotentiGuardant Health (GH) is showing signs of completing a long-term accumulation phase and transitioning into a bullish trend. After breaking out of a major descending trendline and holding above key resistance at $38.30, the stock entered a tight consolidation range — a classic base formation before a potential breakout.
Technical Highlights:
– Confirmed trendline breakout
– Price is consolidating above previous highs
– Entry zone around $50–$51
– First target: $70 (+40%)
– Second target: $103 (+100% from current levels)
Fundamental Support:
Guardant Health is a leading precision oncology company specializing in liquid biopsy technologies for cancer screening and monitoring. The company continues to expand its product offerings, especially in early cancer detection — a market with huge long-term growth potential. Recent news includes positive developments in clinical trials and expanded partnerships, which could significantly boost revenue.
Institutional interest in GH has also been rising, with increased buying activity visible in the most recent 13F filings. The overall market sentiment toward biotech stocks with strong data pipelines is improving, which further supports the bullish outlook.
Conclusion:
GH is a strong candidate for medium- to long-term growth. The technical setup aligns with a fundamental narrative of innovation and market expansion. Partial profit-taking could be considered at $70 and $103. Due to the volatility of biotech stocks, proper risk management and position sizing are essential.

TTD is giving a second chance A few days ago, we mentioned that NASDAQ:TTD could have reached a great buying level around the $44 area. After a recent rally, we’re now seeing a typical bullish continuation pattern. If the flag breaks to the upside, you’ll have a new opportunity to join the upward move.
Once again, a tight stop loss (SL) of 3–4% gives you the potential for a 30% rally. It’s important to consider taking profits before the $100 level, where we see major resistance.

An insurance for your investmentsWhat does SKWD do?
NASDAQ:SKWD is an American insurance company, but not your typical one .
They focus on “specialty insurance”, they cover unique or complex risks that big, traditional insurers often avoid. Think about things like renewable energy, media liability, or niche business programs. This lets them play in markets with less competition and better profit margins.
How’s the business doing?
Strong growth : Their revenues have been growing at around 27% per year, which is much faster than most insurance companies.
Solid profits : In 2024, they made $118.8 million in net income, up 38% from the year before. Their return on equity (ROE)-a key measure of profitability was 16.3%, which is very healthy for this industry.
Premiums keep rising : The amount of insurance they sold (gross written premiums) jumped 20.8% last year, and they keep launching new products in promising areas like life sciences and renewable energy.
Efficient operations: Their “combined ratio” (which shows how well they manage claims and expenses) is around 91.6%. Anything under 100% means they’re making money on their core business, even after paying out claims.
What’s special about their strategy?
They’re all about owning their niche . Instead of trying to be everything to everyone, they pick markets where they can be experts and set the rules.
They keep innovating, launching new specialty products and expanding into growing sectors.
Management is experienced and focused on disciplined growth, not just chasing volume for the sake of it.
What about risks?
Like any insurer, big natural disasters (hurricanes, etc.) can hit their results in a given quarter, but their diversified approach helps cushion the blow.
Their stock isn’t super cheap compared to peers, so they need to keep up the growth to justify the price.
Future outlook
Analysts expect SKWD to keep growing earnings and revenue by about 12–15% per year, which is strong for insurance.
The company’s strategy and track record suggest they can keep grabbing market share in these specialty areas.
Technically
The chart has break a triangle, which is a great trend continuation pattern. Any buy near supports or the trendline would be an amazing opportunity in the mid or long run.

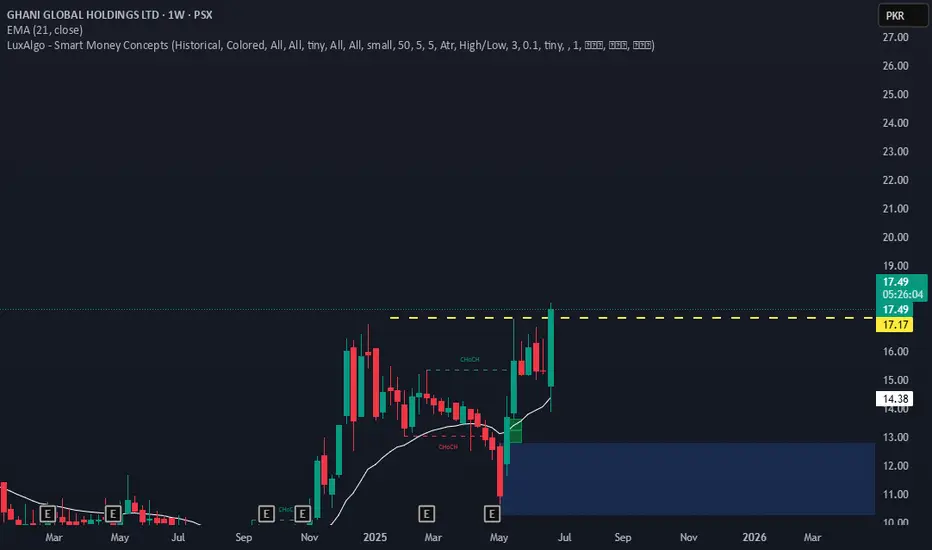
GGL expected Buying Opportunity if this week close above 17.17. we expect bullishness for the next week.
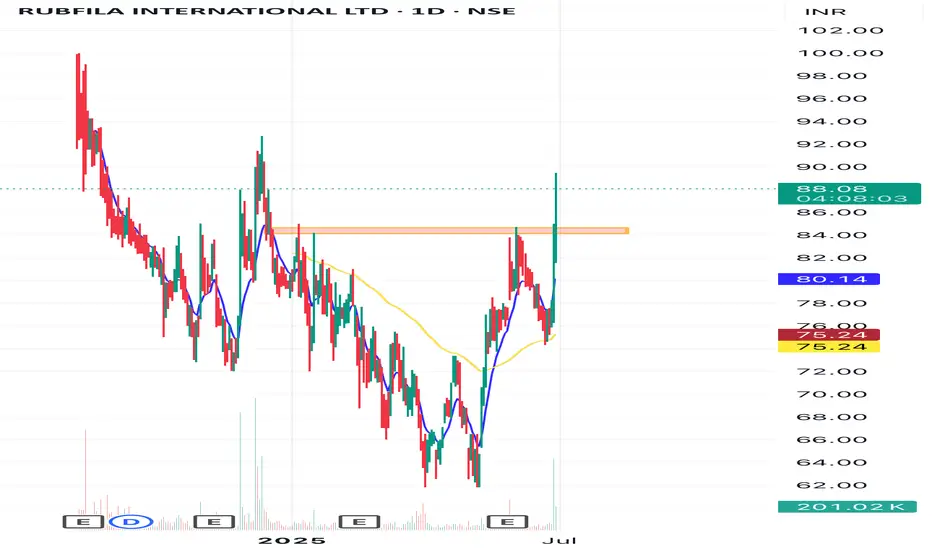
Rubfila on breakout mode?Looks like a undervalued gem!
Seems on uptrend
good volume..
100++ possible
exit below80..
PE less than sector PE.
Fundamentals improved
qtr result positive.
RIL is a part of the Finquest Group,
Mumbai, which has interests in finance, textiles, paper, etc.