NVO to 107 USDTechnical Analysis Summary – NVO
After a prolonged downtrend, the stock established a potential reversal structure:
Wave 1: Initial impulsive rally, marking the first significant move against the prevailing bearish trend.
Wave 2: Healthy corrective pullback that retraced precisely to the 61.8% Fibonacci level of Wave 1, which is a classic depth for a Wave 2 retracement in Elliott Wave Theory.
The price also tested and bounced off the 200-day Simple Moving Average (SMA) on the first attempt, confirming this zone as key technical support.
A hidden bullish divergence formed: while the price created a higher low, the momentum indicator (RSI) printed a lower low. This suggests that sellers exhausted their strength and the primary trend may resume.
Premarket action showed the stock trading about +2% higher, indicating early buying interest and potential momentum continuation.
The projected target for Wave 3, assuming the scenario unfolds, is approximately $107, derived from the 161.8% Fibonacci extension of Wave 1. This also coincides with historically important resistance.
Overall, this setup combines:
✅ A clear Elliott Wave structure (Wave 1-2-3),
✅ Confluence of major support levels (61.8% retracement and the 200-day SMA),
✅ A hidden bullish divergence signaling continuation,
✅ A strong premarket move suggesting institutional interest,
✅ And supportive fundamentals behind the price action.
This is an example of a technically robust scenario with favorable risk/reward characteristics. Traders will watch for confirmation through volume expansion and a breakout above recent swing highs to validate the start of Wave 3.

HAG investors should prepare for downsideHensoldt AG topped out a bit early—unfortunate, but no real drama.
The broader idea of higher highs remains fully intact.
To fuel the next leg up, I could very well see the violet structure playing out, guiding us directly into the bullish rebound zone. But for that to unfold, we first need a clean break below point A.
Should that happen, investors should prepare for roughly 25% downside before the real opportunity begins.
Stay focused. Don’t fear the dip - embrace the setup.

HIMS off to the races to fill the gapNYSE:HIMS is off to the races to fill the upside gap. The NOVO deal that fell thru is an entry opportunity for a strong performer.

STEM reboundstrong rebound of STEM in area 6, only the holding of this level could project towards the 11-13 area

COIN - Looks Cooked, Let's Go ShortCOIN
Is suddenly slumping from a major point of high liquidity:
- It is above ATH resistance
- It is hitting a long term ascending trendline take from the first two significant peaks of the bull trend.
- It has pivoted within a reverse 2.272 Golden Window (up to 2.414) taking the 2 pivots at the base of the minor degree uptrend.
Coinbase has been on a significant rally in this area ahead of other Bitcoin Treasuries that have been corrective.
But if it gains momentum, then we may see some significant downside.
I entered a short and have may let it run a little if it made a new high;- this is a low margin entry 👍.
This analysis is shared for educational purposes only and does not constitute financial advice. Please conduct your own research before making any trading decisions.


$HUT springboard longNASDAQ:HUT with a beautiful chart looks ready to springboard through a volume gap. Support from all long term SMAs and great looking MACD, RSI, and volume profile. Targeting the .5 and then .618 fib retracement levels. NASDAQ:CORZ acquisition catalyst for many of these btc miners.

VOLTAMP | Detailed Analysis | with Target & Stop-lossDisclaimer:
This is not financial advice. Please do your own research or consult with a financial advisor before making any investment decisions. Investments in stocks can be risky and may result in loss of capital.

Berkshire Hathaway: Time to consider exitsHello,
Despite recent market volatility, Berkshire Hathaway (BRK.A, BRK.B) has demonstrated resilience, with its stock rising approximately 16% year-to-date in 2025, significantly outperforming the S&P 500’s 2% decline. This performance has fueled speculation about Warren Buffett’s strategy, particularly whether the “Oracle of Omaha” is capitalizing on the recent market correction to deploy Berkshire’s record $334 billion cash reserve. Let’s examine Berkshire’s current position
Berkshire Hathaway operates a diversified portfolio anchored by its world-class insurance operations, including GEICO. The company also owns Burlington Northern Santa Fe Railroad, a robust energy division, and a wide range of manufacturing, service, and retail businesses. Its $284 billion equity portfolio, featuring long-term holdings like Coca-Cola, American Express, and a reduced but still significant stake in Apple, continues to generate substantial investment income. In 2024, Berkshire reported approximately $30 billion in operating cash flow, underscoring its financial fortress status.
This diversified revenue stream and immense liquidity position Berkshire as a safe haven for investors during turbulent times. Buffett’s reputation for capitalizing on market downturns—evidenced by his $26 billion in deals during the 2008-2009 financial crisis—further bolsters confidence in the company’s ability to navigate corrections.
Recent market corrections, driven by concerns over President Donald Trump’s tariff policies and fears of a global trade war, have seen the S&P 500 drop over 11% from its February 2025 high. Many investors are watching Buffett, expecting him to deploy Berkshire’s massive cash pile to scoop up undervalued assets, as he famously advises to “be greedy when others are fearful.” However, evidence suggests Buffett has been cautious.
In 2024, Berkshire was a net seller of equities for nine consecutive quarters, offloading $134 billion in stocks, including significant reductions in its Apple (67% cut) and Bank of America (34% cut) holdings. Buffett also halted Berkshire’s stock buyback program in the third and fourth quarters of 2024, despite having repurchased $77.8 billion of its own stock since 2018. This pause, combined with a record cash hoard of $334 billion, indicates Buffett may believe valuations remain elevated or that greater opportunities lie ahead.
That said, Buffett has made selective purchases. In Q4 2024, Berkshire initiated new positions in Constellation Brands, Pool Corporation, Domino’s Pizza, Occidental Petroleum, VeriSign, and Sirius XM, with investments like VeriSign ($73 million) and Constellation Brands ($1.24 billion) reflecting Buffett’s preference for companies with strong fundamentals and competitive moats. These moves suggest Buffett is cautiously optimistic about specific sectors, particularly those tied to consumer spending and stable cash flows, but is not yet aggressively buying the broader market dip.
Berkshire’s stock has delivered a compounded annual return of 19.9% since 1965, nearly doubling the S&P 500’s performance over the same period. However, with a market capitalization exceeding $1 trillion and a price-to-sales ratio of 2.67 (a 34% premium to its 10-year average), significant near-term upside may be limited. The conglomerate’s size makes it challenging to find needle-moving investments, and Buffett’s recent restraint in buybacks suggests he views Berkshire’s stock as fully valued at current levels.
For long-term investors, Berkshire remains a compelling hold due to its diversified business model, strong cash flow, and Buffett’s disciplined capital allocation, now transitioning to designated successor Greg Abel. However, those expecting rapid gains should temper expectations, as Berkshire’s scale limits its ability to achieve exponential growth. Investors seeking to emulate Buffett’s strategy might consider his recent picks, such as VeriSign, which benefits from a near-monopoly in internet domain registries, or stalwarts like Coca-Cola, a Dividend King with a 3% yield.
For those considering new positions, waiting for a deeper market pullback could align with Buffett’s value investing principles, especially given his current cash-hoarding stance.

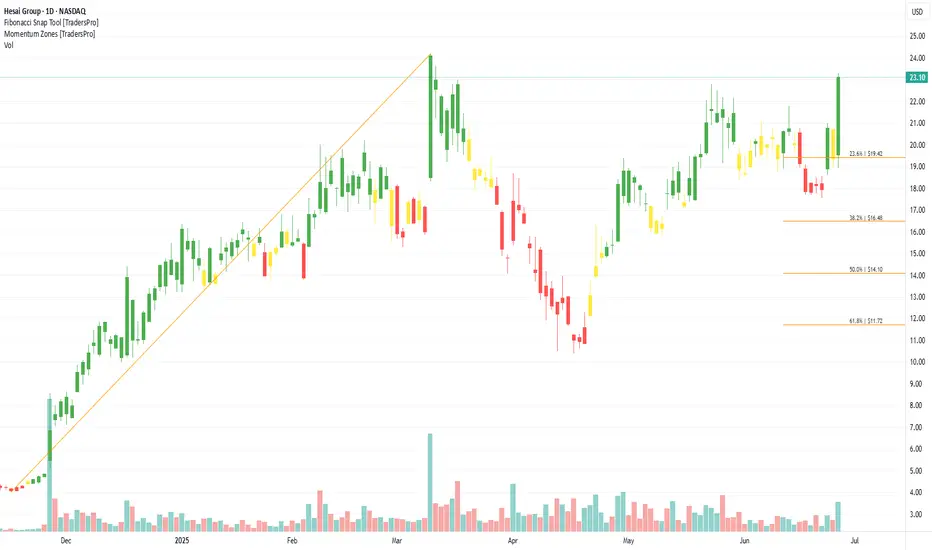
Hesai Group (HSAI) Delivers LiDAR for Self-DrivingHesai Group (HSAI) is a global leader in LiDAR technology, supplying advanced 3D sensing solutions for autonomous vehicles, robotics, and industrial automation. Known for its high-performance sensors and strong partnerships with top mobility companies, Hesai is pushing the frontier of smart transportation. The company’s growth is driven by rising demand for driverless tech, intelligent safety systems, and the worldwide race toward vehicle automation.
On the chart, we see a confirmation bar with rising volume, signaling strong momentum. The price has moved into the momentum zone by breaking above the .236 Fibonacci level. Traders can use the Fibonacci snap tool to set a trailing stop just below that level to lock in gains while allowing room for further upside.
OCGN Breakout from Falling Wedge — Preparing for Next Bullish LeOCGN has shifted from bearish to bullish structure. As long as the price respects the rising channel and moving averages, this setup provides a favorable risk-to-reward for swing traders. Monitor volume and news catalysts, especially around biotech developments and earnings.

Tesla (TSLA) -Bullish Reaccumulation Setup | Smart Money conceptTesla shows a clean CHoCH followed by BOS structure, indicating a potential bullish continuation. The market is forming equal lows into a demand zone (green box), suggesting a possible liquidity sweep before a move higher.
Key Technical Points:
CHoCH (Change of Character) confirmed on strong bullish impulse.
BOS (Break of Structure) signals market intent to continue upward.
Ascending triangle structure with multiple support tests (marked "S").
Anticipated sweep into demand zone: $308–$312 area.
Potential upside target: $365–$375 supply zone.
Bias: Bullish on confirmation of demand reaction.
Disclaimer:
This is not financial advice. Always do your own analysis before investing.

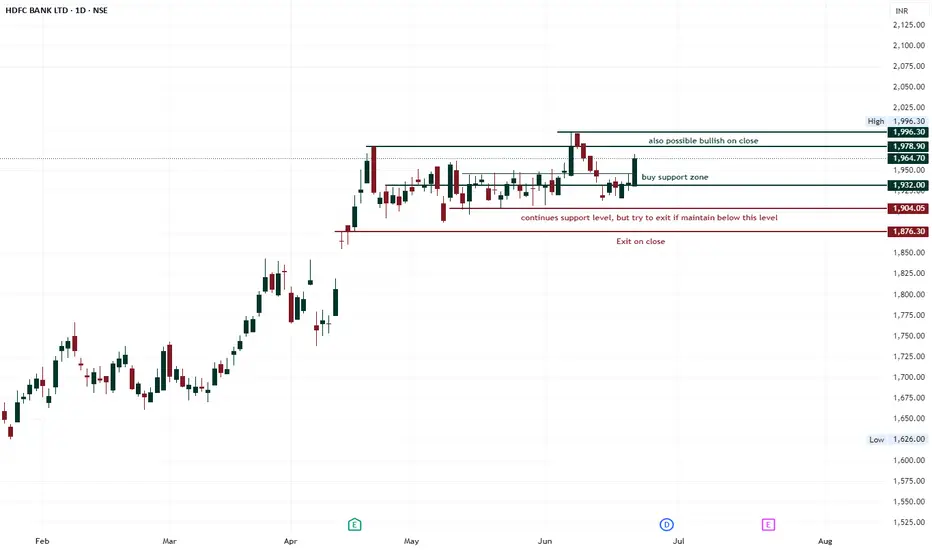
hdfc bank reportbullish pattern with candle pattern. every time support 1905 level, but no break to 1876
Tesla (TSLA) 1H Chart – Wyckoff Cycle in ActionThis chart reflects a textbook Wyckoff pattern unfolding on TSLA’s 1-hour timeframe:
🔹 Accumulation Phase observed early May
🔹 Followed by Manipulation & Distribution – classic trap before markdown
🔹 Sharp selloff led to another Accumulation zone around $305
🔹 Further manipulation wicks indicate smart money involvement
🔹 Now projecting a move towards $360–$370 distribution zone
📌 Structure breakdown:
Smart Money Accumulation ➡️ Manipulation ➡️ Distribution
Bullish momentum building from $306 support
Eyes on reaction near the marked green distribution box 📦
📅 As of June 15, 2025 – chart aligns with Wyckoff theory and institutional behavior.

JPM SELL!!JPM and GS are both overbought here. This market is a bubble like we've never seen the valuations are pie in the sky. Id sell calls here as we'll have a correction on these two names in the next couple of weeks 3 x book wtf

GS SELL overbought GS and JPM are both overbought here. This market is a bubble like we've never seen the valuations are pie in the sky. Id sell calls here as we'll have a correction on these two names in the next couple of weeks. GS 4 hour chart is a screaming SELL

Breakout Alert: AMD Head & Shoulders Points to $160+Overview
Name: Advanced Micro Devices, Inc.
Ticker Symbol: AMD
Exchange: NASDAQ
Founded: 1969
Headquarters: Santa Clara, California, USA
CEO: Lisa Su (as of 2025)Sector: Technology / Semiconductors
About
AMD is a leading semiconductor company known for its high-performance computing and graphics solutions. It competes with Intel and NVIDIA in the CPU, GPU, and data center markets. Its product line includes Ryzen (desktop/laptop CPUs), EPYC (server CPUs), and Radeon (GPUs), with strong expansion in AI and custom silicon for next-gen applications.
Fundamentals
Earnings: AMD reported strong Q1 2025 earnings with a beat on both revenue and EPS, supported by explosive demand in the AI and data center segments.Revenue: $6.52B, up 21% YoY
Outlook: The company raised guidance for the second half of 2025 as it expects to benefit from the AI chip boom and new product rollouts.
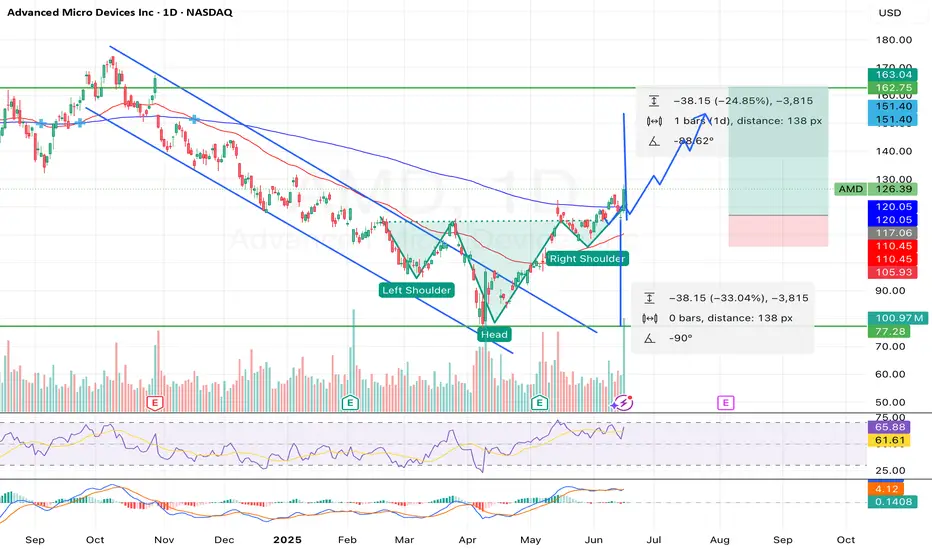
Technicals (4H Chart)
Inverted Head and Shoulders pattern confirmed with neckline breakout around ~$117
Breakout from Falling Channel aligning with bullish reversal structure
Price surged past resistance with strong volume, currently at $126.39 (+9.71%)
RSI at 65.88, approaching overbought but not signaling weakness
MACD bullish crossover, confirming momentum
Short-term target range: $145–$150, with extended projection up to $162.75
📌 Support Levels: $117, $111.50📈 Target Price (TP): $162.75 (based on pattern breakout height projection)
💡 My Take
AMD just pulled off a textbook bullish reversal — inverted head and shoulders breakout combined with a falling channel exit. With strong macro trends in AI hardware and data center expansion, this move feels well-supported fundamentally and technically.
The clean neckline breakout and explosive candle suggest continuation. I am expecting a potential consolidation around $130–$135ish before next leg to $150+. If momentum holds, $162+ is possible before August.
💼 Position
Type: AMD 145 Call
Expiry: July 03, 2025
Quantity: 15
Average Cost Basis: $.038
Date Purchased: June 12, 2025
Last Price: $0.47
Total % Gain/Loss: +23.4%
I entered after the neckline break and riding the wave. AMD’s setup is too clean to ignore — high conviction play.
$HAYPPSwedish SNUS distributer, blue line above the old ATH, and what it looks like its not stopping so far.
I made two trendlines TL1 (First trendline) & TL2 (Second Trendline), because of the steep uptick it made, as long its does not break below the TL1, I think we have a Long position. here.
Just an idea, do you own homework on this.

$AMD – Major Support Flip?📊 Technical Analysis
NASDAQ:AMD looks poised for a breakout continuation, with multiple technical signals aligning:
Price recently flipped major historical support/resistance (~$132.75–133.18), a level that has acted as a launchpad multiple times in the past (highlighted by the boxed reactions).
After a strong rally, a pullback into this zone (marked by the arrow) would be healthy and may offer a prime long opportunity if the level holds.
Bullish projection targets a move toward the next key resistance area around $184.52, followed by a long-term fib extension / prior high zone at $226–227.60.
Structure remains clean – bullish continuation pattern after a breakout from a prolonged range.
⚙️ Macro & Fundamental Drivers
🧠 AI & Data Center Tailwinds
AMD continues to be a major beneficiary of the AI boom, especially with its MI300X AI GPU chips entering competition with Nvidia's offerings.
Big cloud customers (Microsoft, Meta, Amazon) are increasing adoption of AMD’s accelerators in 2025 deployments.
Analysts are increasingly bullish on AMD’s data center market share gains in 2H 2025.
💼 Earnings Momentum
Strong recent earnings report beat both revenue and EPS expectations.
Forward guidance remains upbeat, driven by AI, custom silicon, and embedded segments.
Gross margins expanding — indicating strong operational leverage.
📉 Rate Cut Hopes + Tech Rotation
Markets are pricing in Fed rate cuts late 2025, improving sentiment for high-beta tech.
Institutional flows are rotating back into semiconductors after a Q2 pullback.
🇺🇸 CHIPS Act Support
U.S. government funding continues to support domestic chip production, indirectly benefiting AMD by bolstering its supply chain and CapEx plans.
🎯 Trade Setup
Entry Zone: $133–138 (retest zone / support flip)
Stop Loss: Below $130
Target 1: $184.52
Target 2: $203.71
Target 3 (Stretch): $226–227
⚠️ Risks
Macro risks: Unexpected Fed hawkishness or broader tech selloff.
Competitive risks from Nvidia or delays in data center adoption cycles.
📌 Conclusion
NASDAQ:AMD is retesting a critical structural level with strong bullish momentum. With the AI narrative heating up, macro tailwinds forming, and technicals aligned, this could be the next major breakout candidate in the semiconductor space.

Positional Setup: IDBI Bank Ltd (NSE)Chart Pattern: Cup and Handle Formation
CMP: ₹101.33
Technical Structure: Classic bullish Cup & Handle breakout setup in progress
Volume: Noticeable rise in volumes at breakout zones
Momentum: RSI & moving averages support the trend continuation
📊 Technical Levels (Positional Setup)
Support Zones: ₹95 / ₹90
Breakout Zone: ₹101–104 (once cleared, confirms the breakout)
Targets Post Breakout:
🎯 T1: ₹115
🎯 T2: ₹125
🎯 T3: ₹135
Stop Loss: Below ₹90 (closing basis)

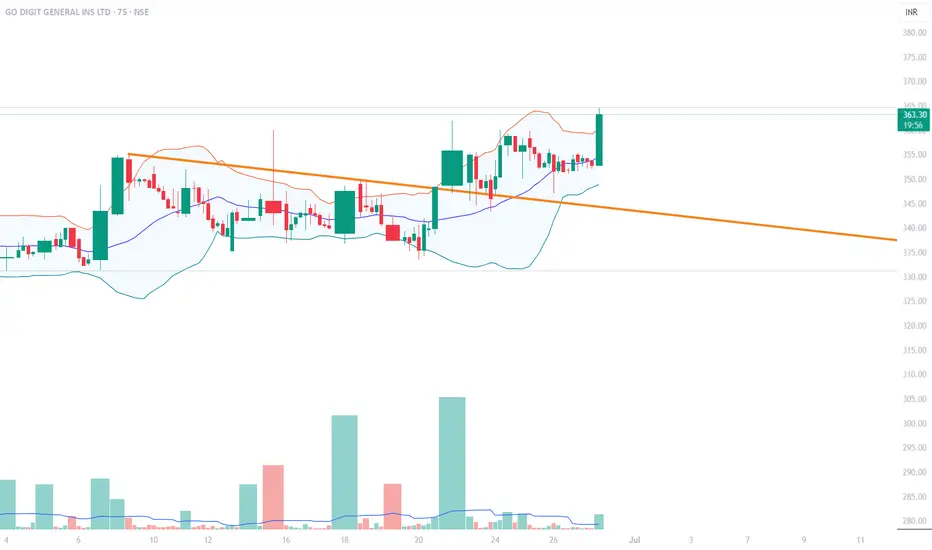
GODIGIT!GODIGIT READY FOR BLAST! SHARP CONSOLIDATION AND BREAKOUT READY TO MAKE A UPWARD MOVE! STOPLOSS 345 AND TARGET 400!
Pls note all the messages posted are for study and guidance purpose
Please consult your financial advisor before investing ⚠