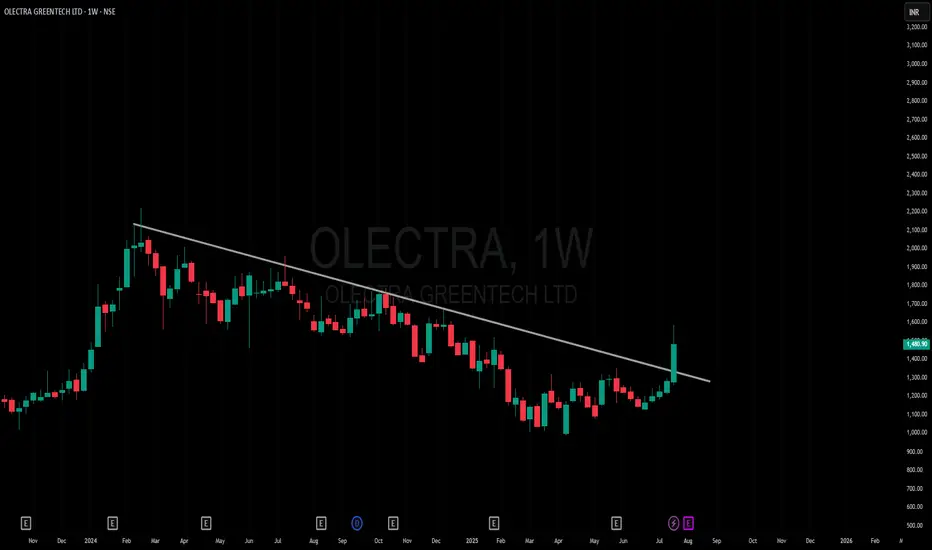
Amazing breakout on WEEKLY Timeframe - OLECTRACheckout an amazing breakout happened in the stock in Weekly timeframe, macroscopically seen in Daily timeframe. Having a great favor that the stock might be bullish expecting a staggering returns of minimum 25% TGT. IMPORTANT BREAKOUT LEVELS ARE ALWAYS RESPECTED!
NOTE for learners: Place the breakout levels as per the chart shared and track it yourself to get amazed!!
#No complicated chart patterns
#No big big indicators
#No Excel sheet or number magics
TRADE IDEA: WAIT FOR THE STOCK TO BREAKOUT IN WEEKLY TIMEFRAME ABOVE THIS LEVEL.
Checkout an amazing breakout happened in the stock in Weekly timeframe.
Breakouts happening in longer timeframe is way more powerful than the breakouts seen in Daily timeframe. You can blindly invest once the weekly candle closes above the breakout line and stay invested forever. Also these stocks breakouts are lifelong predictions, it means technically these breakouts happen giving more returns in the longer runs. Hence, even when the scrip makes a loss of 10% / 20% / 30% / 50%, the stock will regain and turn around. Once they again enter the same breakout level, they will flyyyyyyyyyyyy like a ROCKET if held in the portfolio in the longer run.
Time makes money, GREEDY & EGO will not make money.
Also, magically these breakouts tend to prove that the companies turn around and fundamentally becoming strong. Also the magic happens when more diversification is done in various sectors under various scripts with equal money invested in each N500 scripts.
The real deal is when to purchase and where to purchase the stock. That is where Breakout study comes into play.
Check this stock which has made an all time low and high chances that it makes a "V" shaped recovery.
> Taking support at last years support or breakout level
> High chances that it reverses from this point.
> Volume dried up badly in last few months / days.
> Very high suspicion based analysis and not based on chart patterns / candle patterns deeply.
> VALUABLE STOCK AVAILABLE AT A DISCOUNTED PRICE
> OPPURTUNITY TO ACCUMULATE ADEQUATE QUANTITY
> MARKET AFTER A CORRECTION / PANIC FALL TO MAKE GOOD INVESTMENT
DISCLAIMER : This is just for educational purpose. This type of analysis is equivalent to catching a falling knife. If you are a warrior, you throw all the knives back else you will be sorrow if it hits SL. Make sure to do your analysis well. This type of analysis only suits high risks investor and whose is willing to throw all the knives above irrespective of any sectoral rotation. BE VERY CAUTIOUS AS IT IS EXTREME BOTTOM FISHING.
HOWEVER, THIS IS HOW MULTIBAGGERS ARE CAUGHT !
STOCK IS AT RIGHT PE / RIGHT EVALUATION / MORE ROAD TO GROW / CORRECTED IV / EXCELLENT BOOKS / USING MARKET CRASH AS AN OPPURTUNITY / EPS AT SKY.
LET'S PUMP IN SOME MONEY AND REVOLUTIONIZE THE NATION'S ECONOMY!
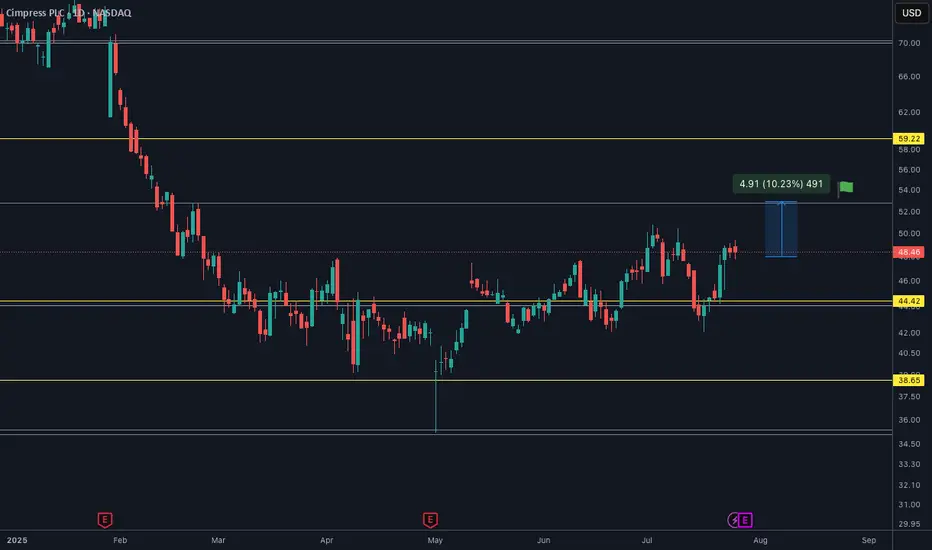
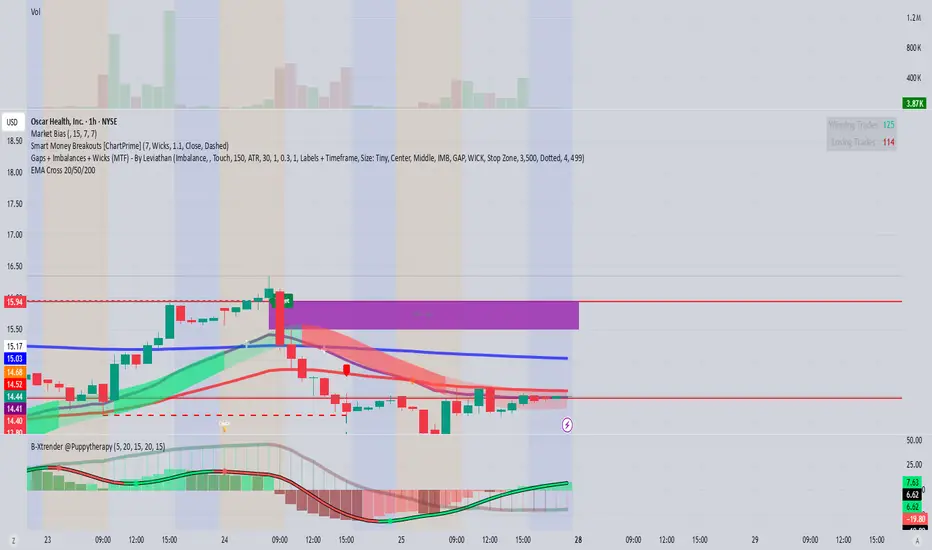
CMPR is ready for $53It will soon go to $53 I assume. Only question is quarterly releasing on 29th of July so in case things go wrong below $44 is not wanted.
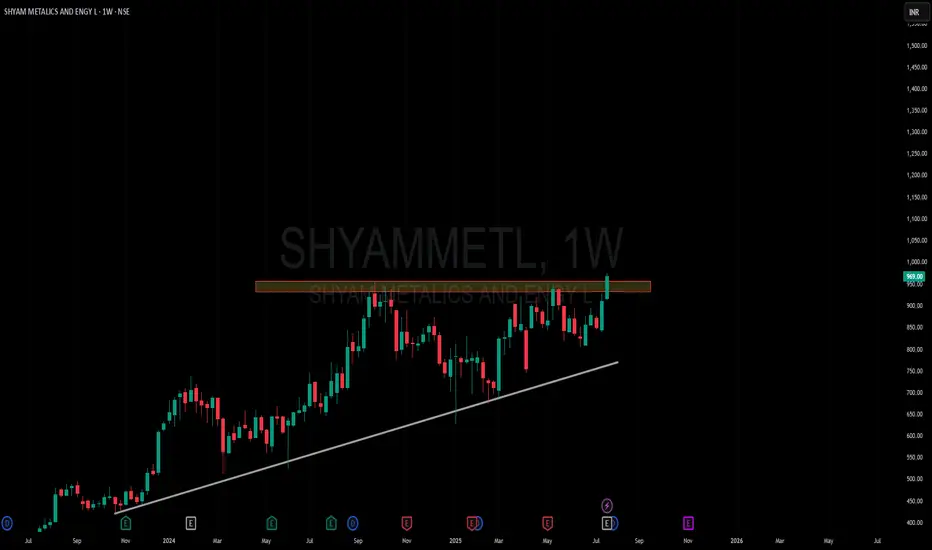
Amazing breakout on WEEKLY Timeframe - SHYAMMETLCheckout an amazing breakout happened in the stock in Weekly timeframe, macroscopically seen in Daily timeframe. Having a great favor that the stock might be bullish expecting a staggering returns of minimum 25% TGT. IMPORTANT BREAKOUT LEVELS ARE ALWAYS RESPECTED!
NOTE for learners: Place the breakout levels as per the chart shared and track it yourself to get amazed!!
#No complicated chart patterns
#No big big indicators
#No Excel sheet or number magics
TRADE IDEA: WAIT FOR THE STOCK TO BREAKOUT IN WEEKLY TIMEFRAME ABOVE THIS LEVEL.
Checkout an amazing breakout happened in the stock in Weekly timeframe.
Breakouts happening in longer timeframe is way more powerful than the breakouts seen in Daily timeframe. You can blindly invest once the weekly candle closes above the breakout line and stay invested forever. Also these stocks breakouts are lifelong predictions, it means technically these breakouts happen giving more returns in the longer runs. Hence, even when the scrip makes a loss of 10% / 20% / 30% / 50%, the stock will regain and turn around. Once they again enter the same breakout level, they will flyyyyyyyyyyyy like a ROCKET if held in the portfolio in the longer run.
Time makes money, GREEDY & EGO will not make money.
Also, magically these breakouts tend to prove that the companies turn around and fundamentally becoming strong. Also the magic happens when more diversification is done in various sectors under various scripts with equal money invested in each N500 scripts.
The real deal is when to purchase and where to purchase the stock. That is where Breakout study comes into play.
Check this stock which has made an all time low and high chances that it makes a "V" shaped recovery.
> Taking support at last years support or breakout level
> High chances that it reverses from this point.
> Volume dried up badly in last few months / days.
> Very high suspicion based analysis and not based on chart patterns / candle patterns deeply.
> VALUABLE STOCK AVAILABLE AT A DISCOUNTED PRICE
> OPPURTUNITY TO ACCUMULATE ADEQUATE QUANTITY
> MARKET AFTER A CORRECTION / PANIC FALL TO MAKE GOOD INVESTMENT
DISCLAIMER : This is just for educational purpose. This type of analysis is equivalent to catching a falling knife. If you are a warrior, you throw all the knives back else you will be sorrow if it hits SL. Make sure to do your analysis well. This type of analysis only suits high risks investor and whose is willing to throw all the knives above irrespective of any sectoral rotation. BE VERY CAUTIOUS AS IT IS EXTREME BOTTOM FISHING.
HOWEVER, THIS IS HOW MULTIBAGGERS ARE CAUGHT !
STOCK IS AT RIGHT PE / RIGHT EVALUATION / MORE ROAD TO GROW / CORRECTED IV / EXCELLENT BOOKS / USING MARKET CRASH AS AN OPPURTUNITY / EPS AT SKY.
LET'S PUMP IN SOME MONEY AND REVOLUTIONIZE THE NATION'S ECONOMY!
GADT regaining strength to move UP GADT regaining strength to move UP and needs to be placed on watchlist. Important Supposts and Resistances marked on chart. the dotted lines are comparatively more important than the simple ones, please note. Light Red zone will hopefully be the first to getting achieved. Keep fingers crossed.

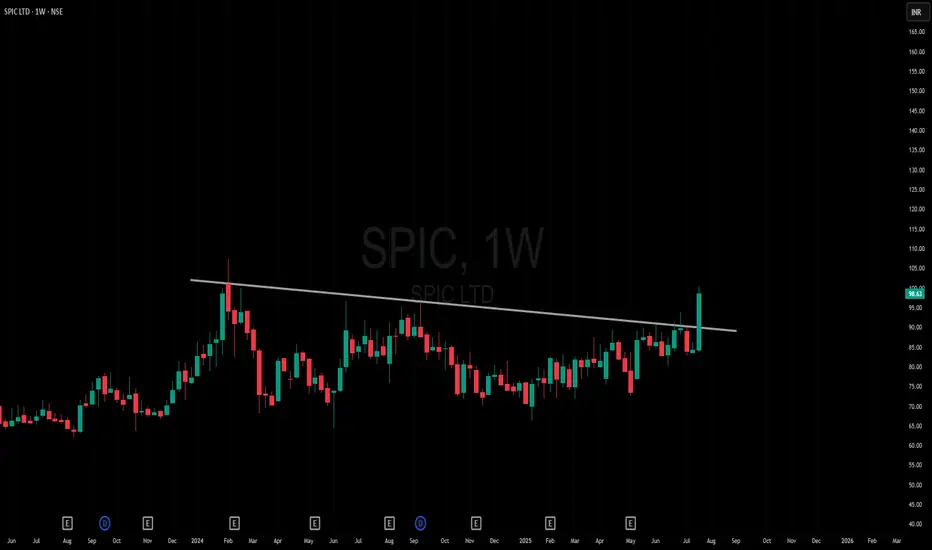
Amazing breakout on WEEKLY Timeframe - SPICCheckout an amazing breakout happened in the stock in Weekly timeframe, macroscopically seen in Daily timeframe. Having a great favor that the stock might be bullish expecting a staggering returns of minimum 25% TGT. IMPORTANT BREAKOUT LEVELS ARE ALWAYS RESPECTED!
NOTE for learners: Place the breakout levels as per the chart shared and track it yourself to get amazed!!
#No complicated chart patterns
#No big big indicators
#No Excel sheet or number magics
TRADE IDEA: WAIT FOR THE STOCK TO BREAKOUT IN WEEKLY TIMEFRAME ABOVE THIS LEVEL.
Checkout an amazing breakout happened in the stock in Weekly timeframe.
Breakouts happening in longer timeframe is way more powerful than the breakouts seen in Daily timeframe. You can blindly invest once the weekly candle closes above the breakout line and stay invested forever. Also these stocks breakouts are lifelong predictions, it means technically these breakouts happen giving more returns in the longer runs. Hence, even when the scrip makes a loss of 10% / 20% / 30% / 50%, the stock will regain and turn around. Once they again enter the same breakout level, they will flyyyyyyyyyyyy like a ROCKET if held in the portfolio in the longer run.
Time makes money, GREEDY & EGO will not make money.
Also, magically these breakouts tend to prove that the companies turn around and fundamentally becoming strong. Also the magic happens when more diversification is done in various sectors under various scripts with equal money invested in each N500 scripts.
The real deal is when to purchase and where to purchase the stock. That is where Breakout study comes into play.
Check this stock which has made an all time low and high chances that it makes a "V" shaped recovery.
> Taking support at last years support or breakout level
> High chances that it reverses from this point.
> Volume dried up badly in last few months / days.
> Very high suspicion based analysis and not based on chart patterns / candle patterns deeply.
> VALUABLE STOCK AVAILABLE AT A DISCOUNTED PRICE
> OPPURTUNITY TO ACCUMULATE ADEQUATE QUANTITY
> MARKET AFTER A CORRECTION / PANIC FALL TO MAKE GOOD INVESTMENT
DISCLAIMER : This is just for educational purpose. This type of analysis is equivalent to catching a falling knife. If you are a warrior, you throw all the knives back else you will be sorrow if it hits SL. Make sure to do your analysis well. This type of analysis only suits high risks investor and whose is willing to throw all the knives above irrespective of any sectoral rotation. BE VERY CAUTIOUS AS IT IS EXTREME BOTTOM FISHING.
HOWEVER, THIS IS HOW MULTIBAGGERS ARE CAUGHT !
STOCK IS AT RIGHT PE / RIGHT EVALUATION / MORE ROAD TO GROW / CORRECTED IV / EXCELLENT BOOKS / USING MARKET CRASH AS AN OPPURTUNITY / EPS AT SKY.
LET'S PUMP IN SOME MONEY AND REVOLUTIONIZE THE NATION'S ECONOMY!
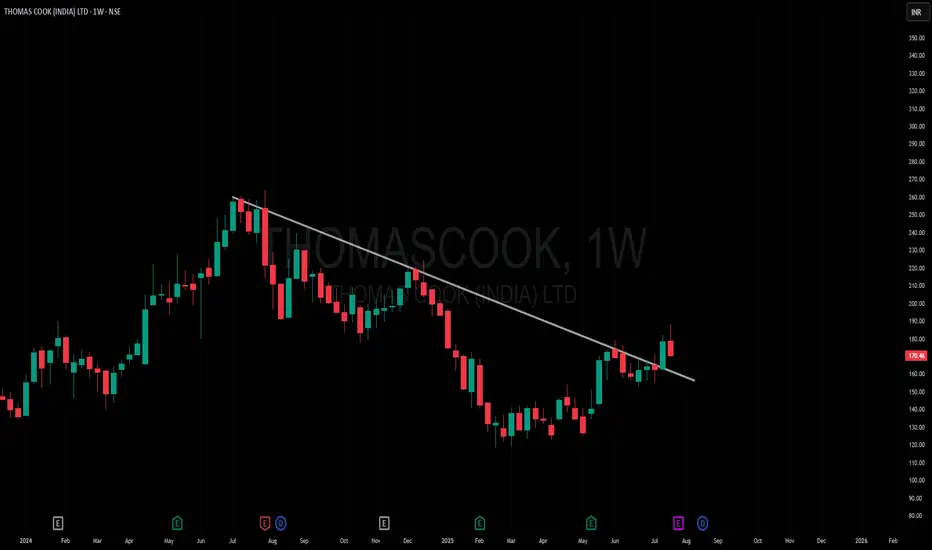
Amazing breakout on WEEKLY Timeframe - THOMASCOOKCheckout an amazing breakout happened in the stock in Weekly timeframe, macroscopically seen in Daily timeframe. Having a great favor that the stock might be bullish expecting a staggering returns of minimum 25% TGT. IMPORTANT BREAKOUT LEVELS ARE ALWAYS RESPECTED!
NOTE for learners: Place the breakout levels as per the chart shared and track it yourself to get amazed!!
#No complicated chart patterns
#No big big indicators
#No Excel sheet or number magics
TRADE IDEA: WAIT FOR THE STOCK TO BREAKOUT IN WEEKLY TIMEFRAME ABOVE THIS LEVEL.
Checkout an amazing breakout happened in the stock in Weekly timeframe.
Breakouts happening in longer timeframe is way more powerful than the breakouts seen in Daily timeframe. You can blindly invest once the weekly candle closes above the breakout line and stay invested forever. Also these stocks breakouts are lifelong predictions, it means technically these breakouts happen giving more returns in the longer runs. Hence, even when the scrip makes a loss of 10% / 20% / 30% / 50%, the stock will regain and turn around. Once they again enter the same breakout level, they will flyyyyyyyyyyyy like a ROCKET if held in the portfolio in the longer run.
Time makes money, GREEDY & EGO will not make money.
Also, magically these breakouts tend to prove that the companies turn around and fundamentally becoming strong. Also the magic happens when more diversification is done in various sectors under various scripts with equal money invested in each N500 scripts.
The real deal is when to purchase and where to purchase the stock. That is where Breakout study comes into play.
Check this stock which has made an all time low and high chances that it makes a "V" shaped recovery.
> Taking support at last years support or breakout level
> High chances that it reverses from this point.
> Volume dried up badly in last few months / days.
> Very high suspicion based analysis and not based on chart patterns / candle patterns deeply.
> VALUABLE STOCK AVAILABLE AT A DISCOUNTED PRICE
> OPPURTUNITY TO ACCUMULATE ADEQUATE QUANTITY
> MARKET AFTER A CORRECTION / PANIC FALL TO MAKE GOOD INVESTMENT
DISCLAIMER : This is just for educational purpose. This type of analysis is equivalent to catching a falling knife. If you are a warrior, you throw all the knives back else you will be sorrow if it hits SL. Make sure to do your analysis well. This type of analysis only suits high risks investor and whose is willing to throw all the knives above irrespective of any sectoral rotation. BE VERY CAUTIOUS AS IT IS EXTREME BOTTOM FISHING.
HOWEVER, THIS IS HOW MULTIBAGGERS ARE CAUGHT !
STOCK IS AT RIGHT PE / RIGHT EVALUATION / MORE ROAD TO GROW / CORRECTED IV / EXCELLENT BOOKS / USING MARKET CRASH AS AN OPPURTUNITY / EPS AT SKY.
LET'S PUMP IN SOME MONEY AND REVOLUTIONIZE THE NATION'S ECONOMY!
Retro Editors' picks 2022Going further in our retro EP selection , we present to you the third collection of additional scripts that have earned a spot in our Editors' picks, now from 2022.
These retrospective selections reflect our continued commitment to honoring outstanding contributions in our community, regardless of when they were published. To the authors of these highlighted scripts: our sincere thanks, on behalf of all TradingViewers. Congrats!
Volume Profile, Pivot Anchored by DGT - dgtrd
Estimated Time At Price - KioseffTrading
Signs of the Times - LucF
Strategy (library) - TradingView
Intrabar Efficiency Ratio - TradingView
Over the next two months, in the last week of each month, we will share retro Editors' picks for subsequent years:
August: retro EPs for 2023
September: retro EPs for 2024
They will be visible in the Editors' picks feed .
Previously published retro Editors' picks:
May: retro EPs for 2020
June: retro EPs for 2021
█ What are Editors' picks ?
The Editors' picks showcase the best open-source script publications selected by our PineCoders team. Many of these scripts are original and only available on TradingView. These picks are not recommendations to buy or sell anything or use a specific indicator. We aim to highlight the most interesting publications to encourage learning and sharing in our community.
Any open-source script publication in the Community Scripts can be picked if it is original, provides good potential value to traders, includes a helpful description, and complies with the House Rules.
— The PineCoders team
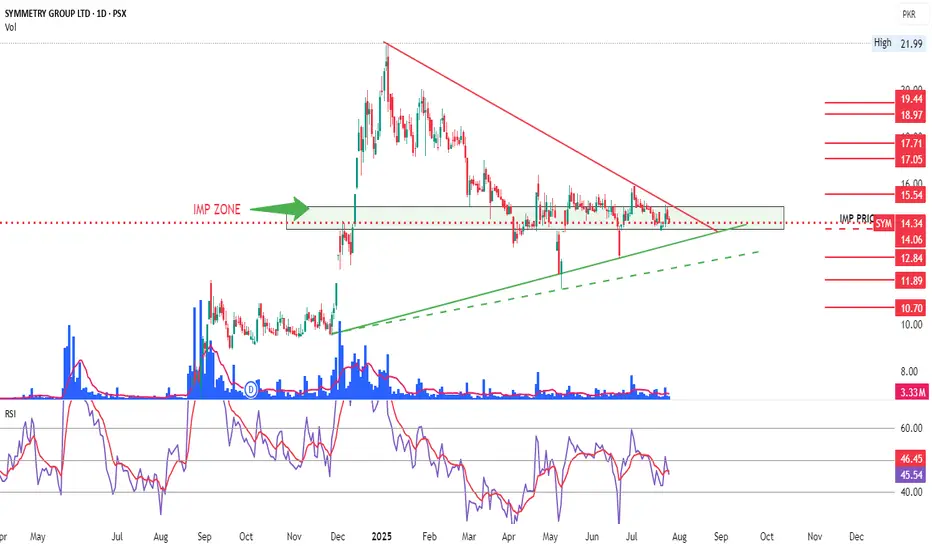
SYM another perspectiveAnother perspective of SYM on the basis of Ascending and Descending Channels along with Supports and Resistances marked on chart for instant help.

SYM in a sqeez and deciding to go either way Asymmetrical Triangle pattern. Can or may break in the direction of the original trend, which as per chart is on the upside. The marked zone is of significance and needs to be sustained for upward move.
Red marked lines are immediate Supports and Resistances.
Bearish potential detected for SDFEntry conditions:
(i) lower share price for ASX:SDF along with swing of DMI indicator towards bearishness and RSI downwards, and
(ii) observing market reaction around the share price of $5.89 (open of 20th June).
Stop loss for the trade would be:
(i) above the potential prior resistance of $6.08 from the open of 4th December 2024, or
(i) above the potential prior resistance of $6.19 from the open of 3rd July 2024, depending on risk tolerance.

Bullish potential detected for WDSEntry conditions:
(i) higher share price for ASX:WDS along with swing up of the DMI indicators and swing up of the RSI indicator, and
(ii) observation of market reaction at the support/resistance level at $24.87 (from the open of 14th February).
Stop loss for the trade would be, dependent of risk tolerance (once the trade is activated):
(i) below the support level from the open of 15th July (i.e.: below $23.95), or
(ii) below the recent swing low of 30th June (i.e.: below $23.24).
NOTE: Positive momentum move on 23rd July already in play (suggested not to chase this initial move and await a retracement back towards the support/resistance level of $24.87 and observe the market reaction - potentially overbought with resistance above current price area of $26.20 as at 25th July). If the move keeps going, let it go.

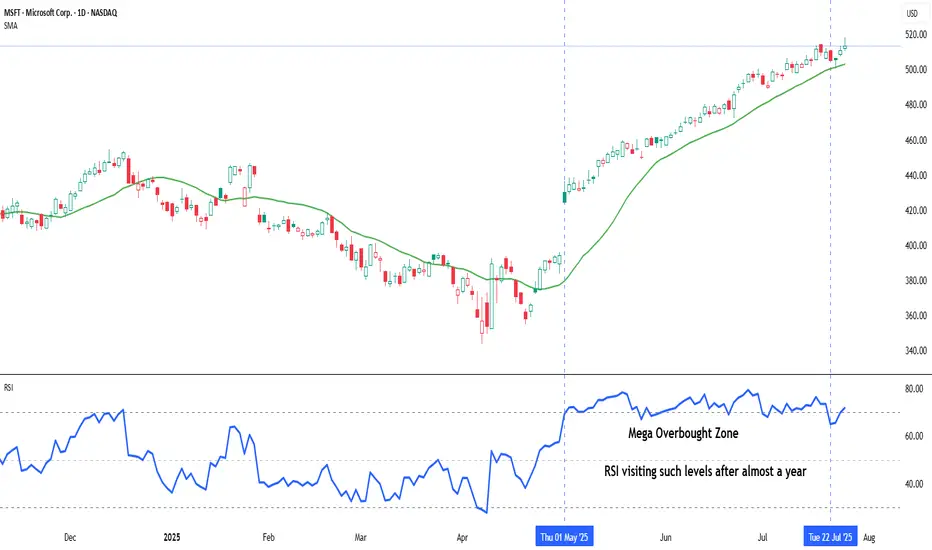
Indicator Decoded: RSI Mega Zones: Signals from the EdgeMost traders are familiar with the textbook RSI levels—70 indicating overbought and 30 indicating oversold. But markets, especially in strong momentum phases, do not always obey these boundaries. That is where the concept of Mega Overbought and Mega Oversold zones becomes vital. These are not fixed thresholds, but adaptive zones often beyond 80 and below 20, where the RSI reflects extreme strength or weakness. Rather than acting as reversal points, these levels often signal trend continuation.
A reading above 80 is typically seen during powerful uptrends or post-breakout rallies. It indicates not just buying, but unhesitating, aggressive demand, especially after key resistance zones have been cleared. Such RSI levels have often not been seen in several months—if not more than a year—making their appearance especially significant. Rather than a signal of exhaustion, this may be the start of a major trend, suggesting that the broader structure of the stock or index has shifted decisively. Traders who misinterpret this as a reversal signal often find themselves fighting momentum. Instead, price tends to grind higher, sometimes pausing briefly before further gains. This is why the chapter suggests using Mega Overbought zones as confirmation of bullish control, not a trigger for counter-trades.
The inverse applies to the Mega Oversold zone—RSI falling below 20. This is usually not a buy-the-dip moment, especially if the broader trend and chart structure are bearish. Such readings typically accompany panic-driven breakdowns, where sellers dominate without any counterforce. These extreme values are often rare and may not have appeared for months or even over a year, marking a moment where the market’s character may be undergoing a structural change. As with Mega Overbought, context is critical. If RSI hits such depths after prolonged distribution or a topping pattern, it does not indicate value—it confirms that the tide has turned, and a strong downtrend may be setting in.
Both Mega zones are best used in conjunction with structure—trendlines, volume shifts, anchored VWAP zones, or price patterns. The RSI alone is not enough. But when it aligns with other technical signals, a Mega Overbought or Oversold status becomes a momentum amplifier, not a contrarian prompt. In fact, your RSI chapter rightly warns that entering against such zones can be fatal unless clear divergences, climax patterns, or volume exhaustion are also present. Think of these extremes not as ceilings or floors, but as accelerators when backed by structure.
A word of caution: These signals are rare and often widely spaced. The real challenge lies in managing risk–reward, as strong momentum and shallow pullbacks can make it difficult to find entries with favourable R:R ratios.
Chart: Microsoft Corp. (MSFT) – Daily Chart with 20-DMA and RSI (as on July 25, 2025)
Microsoft continues its strong upward trajectory, with price action staying well above the rising 20-day simple moving average. The recent surge in RSI into the mega overbought zone marks a significant shift in momentum, as the indicator revisits such elevated levels after nearly a year—an occurrence that often coincides with extended bullish phases.
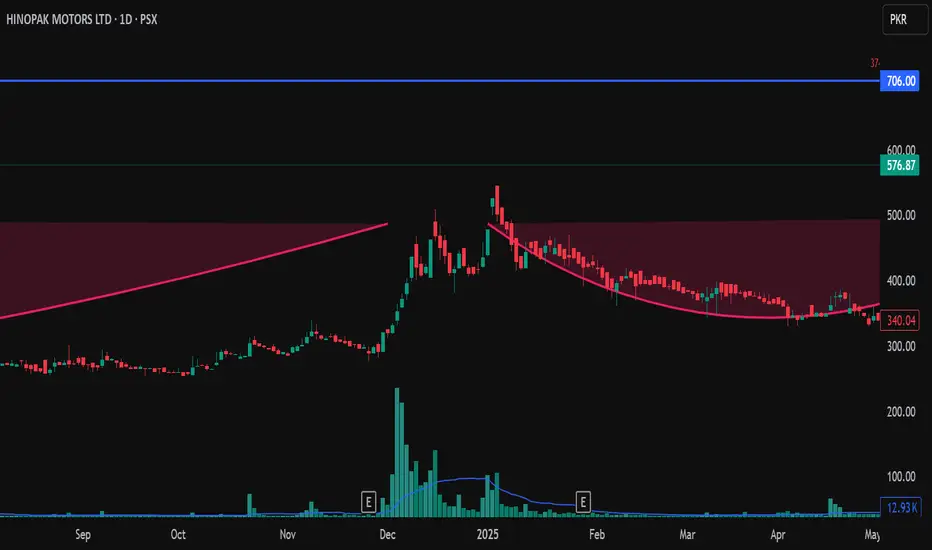
hinobuy at 522. and 470, tp 700. if you want detail plz ask. i m not writing much right now. stay cool
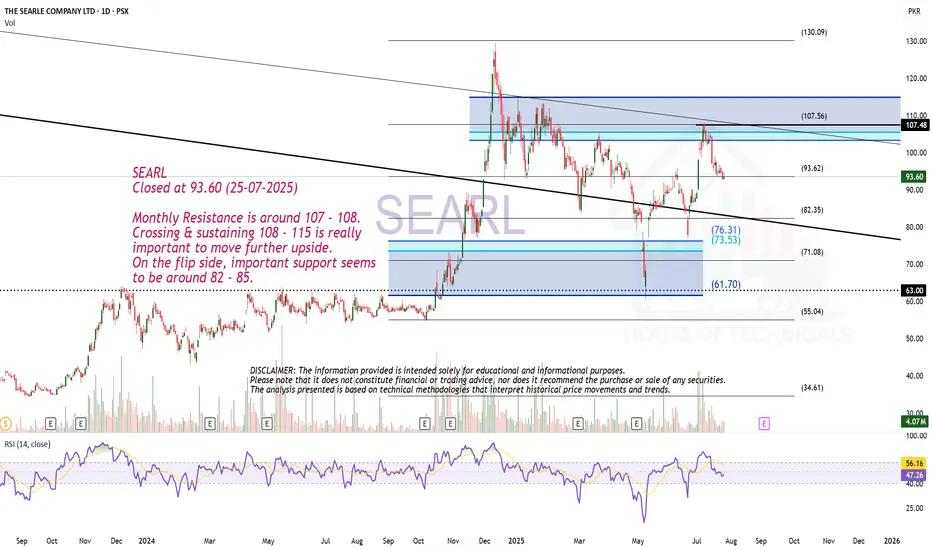
Play on Levels.SEARL
Closed at 93.60 (25-07-2025)
Monthly Resistance is around 107 - 108.
Crossing & sustaining 108 - 115 is really
important to move further upside.
On the flip side, important support seems
to be around 82 - 85.
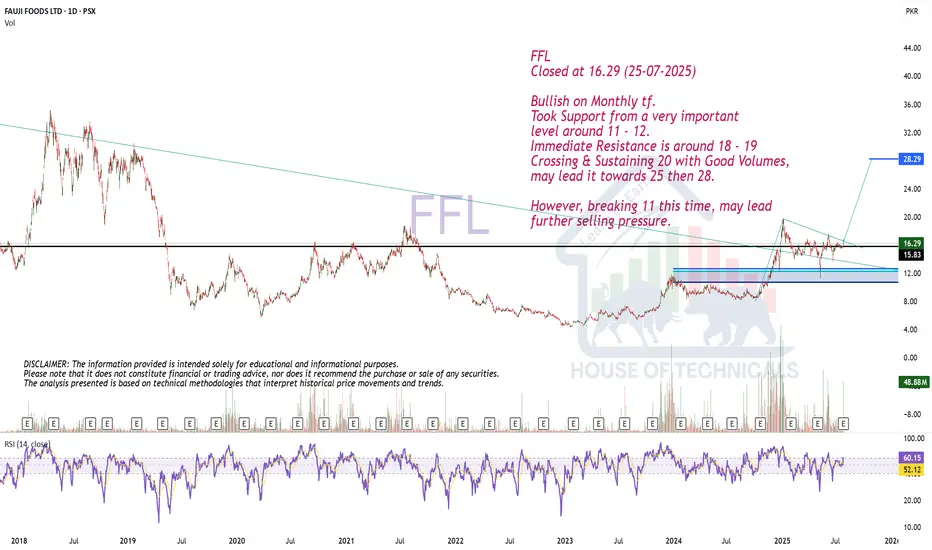
Bullish on Monthly tf.FFL
Closed at 16.29 (25-07-2025)
Bullish on Monthly tf.
Took Support from a very important
level around 11 - 12.
Immediate Resistance is around 18 - 19
Crossing & Sustaining 20 with Good Volumes,
may lead it towards 25 then 28.
However, breaking 11 this time, may lead
further selling pressure.
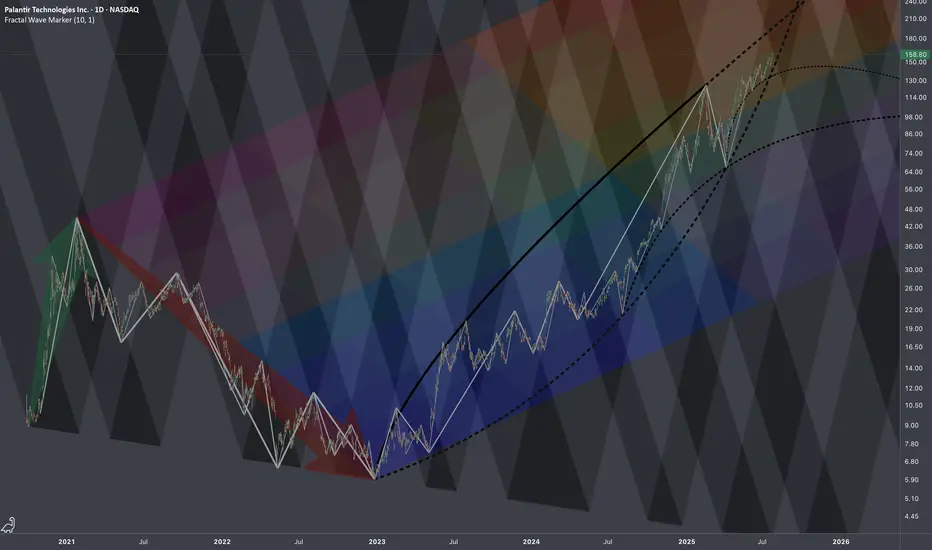
$PLTR: Regressive Heatmap🏛️ Research Notes
Technically this looks overbought, but fundamentally we know that under current administration this company is clear beneficiary (new contracts). Seems to explain why chart's dips were bought off extending bullish phases of cycle. However, there is still always a limit (as price keeps moving up, it alters the chances and magnitude of counter-move). Therefore, I'll test how wide range of 2021-2022yrs drop (prev cycle) can define the bullrun of current cycle. I'd say the very fact of anchoring the structure to actual chart points inherits its texture in next series of fractal based fib ratios.
All observed key coordinates build up into the following cross-cycle interconnections:
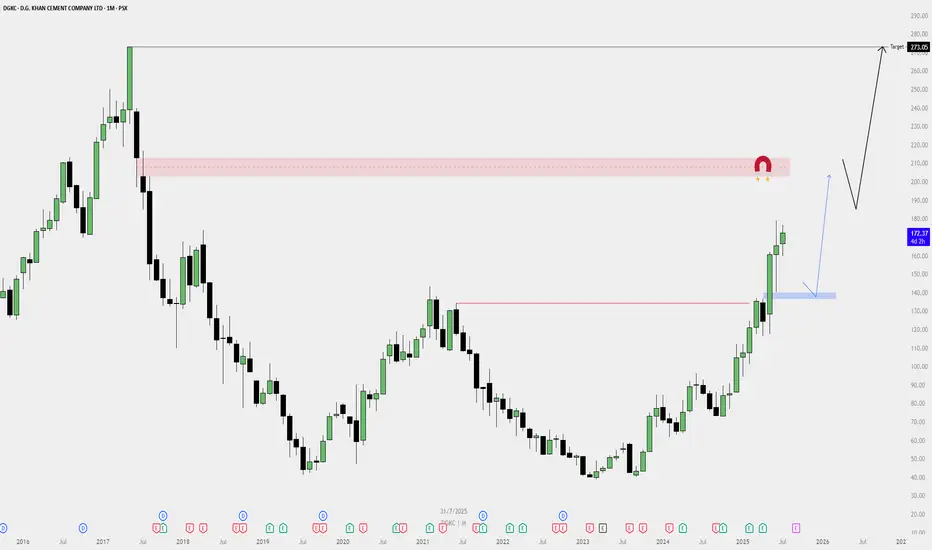
DGKC Monthly Buy Plan — Bullish Outlook📈 DGKC Monthly Buy Plan — Bullish Outlook
✅ Bias: Strongly Bullish
Price has broken major resistance levels with high momentum, forming a big bull trend on the monthly timeframe.
🔍 Key Observations:
Break of Structure:
Price broke past a major resistance zone (previous high).
Strong monthly green candles show institutional interest.
Demand Zone (Blue Box):
A fresh demand zone is formed — a possible area for pullback re-entry.
If price retests this zone, it may offer a high-probability long setup.
Liquidity Magnet Zone (Red Box):
A clear monthly imbalance / supply zone around the 210–220 range.
Could act as a temporary resistance before continuation.
Final Target:
Monthly inefficiency / liquidity target at 273.05, likely the final destination of the move.
Market structure suggests this level can be reached before any major reversal.
🔄 Plan Execution:
🔵 Scenario 1 (Pullback Entry):
Wait for a pullback to the blue demand zone.
Look for lower timeframe confirmation to enter long.
🔵 Scenario 2 (Momentum Continuation):
If price continues without deep pullback, consider smaller timeframes for continuation setups.
Do not chase price; wait for valid structure.
Wait for the Proper Support Level.BNWM
Closed at 81.13 (25-07-2025)
S1 seems to be around 76 - 76.50
& S2 around 68 - 69
Though Bullish on Bigger tf but
may re-test the mentioned Support
levels.
Upside it may reach 90 , 99 & then 110- 112

Saudi Aramco Base Oil Co. (Luberef - 2223) on the Daily timefram🔻 Sell Plan Summary
🔴 Key Supply Zones:
Monthly Fair Value Gap (FVG) / Premium Supply Zone — (Red Box around 108–110 SAR)
Labeled as “M fvg T2,4” on your chart.
Price previously reversed from this zone, indicating strong selling pressure.
Daily Bearish FVG / Rejection Zone — (Red Zone around 104.5 SAR)
Price is reacting to this short-term supply area.
It hasn't closed above this zone, showing weak bullish momentum.
🔵 Target Zone:
Daily Bullish Fair Value Gap (FVG) — (Blue Box: 96.5–98.5 SAR)
This is your likely downside target, situated in the discount zone.
A strong demand area where price may find support.
📉 Market Structure:
Price formed a lower high, suggesting bearish structure.
Recent candles show rejections from supply, supporting a short bias.
The chart includes a red arrow showing expected downward movement.

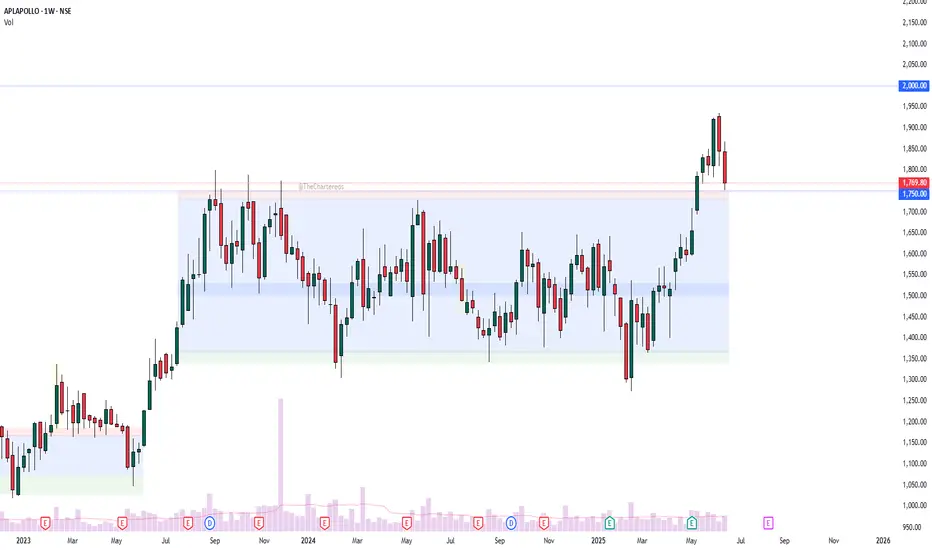
APLAPOLLO - retest phase?APL Apollo – Chart Analysis
The structure is quite clear:
Price consolidated within a tight range for nearly 2 years.
This was followed by a strong breakout accompanied by a notable volume spike.
Currently, the stock appears to be in the retest phase of the breakout zone.
Fundamental Trigger:
📢 APL Apollo Q4 Results: Net profit up 72% YoY; Board approves ₹1,500 Cr capex plan.
What’s next?
Will the retest hold and lead to the next leg up?
Let me know your thoughts 👇
Disclaimer: This analysis is for educational and informational purposes only. It is not investment advice or a recommendation to buy or sell any security. Please do your own research or consult a financial advisor before making any investment decisions. I am not a SEBI-registered advisor.
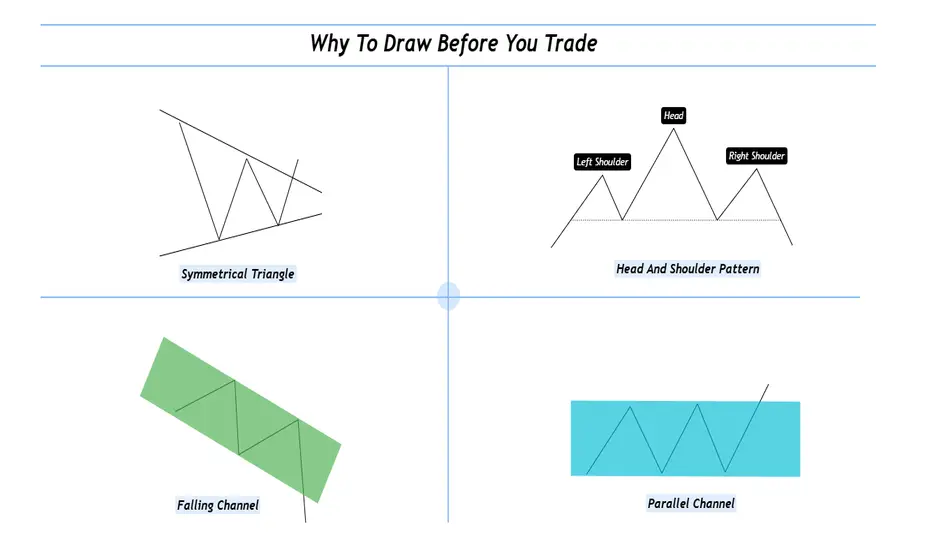
Why To Draw Before You Trade ?Hello fellow traders and respected members of the trading community, In a fast paced market dominated by automation and algorithms, we often forget the value of simply picking up a tool and drawing on our charts. Let’s revisit why this fundamental habit still holds the power to sharpen our edge and elevate our decision-making.
Why We Should Draw and Trade? Turning Charts Into Clarity
Introduction-:
In an age of auto-generated indicators, black-box algorithms, and AI-driven signals, many traders are drifting away from one of the most fundamental trading tools: manual chart drawing.
But what if the very act of drawing is not just an old habit—but a powerful trading edge?
This publication explores why actively drawing on charts and trading based on visual context can elevate your market understanding and execution like nothing else.
1. What Does It Mean to “Draw and Trade? Drawing isn’t just technical analysis it’s interactive thinking. When you draw, you're mapping the structure of the market using tools like
Trendlines
Support & Resistance zones
Chart Patterns (Head & Shoulders, Flags, Triangles, etc.)
Supply & Demand levels
Gaps, Fibonacci levels, and more
Once the chart is marked, you’re no longer entering trades blindly you’re entering with context, clarity, and confidence.
2. The Psychology Behind Drawing
Manual drawing engages your focus, discipline, and decision-making. You don’t just predict, you process and It forces you to slow down helping reduce impulsive trades. Drawing anchors your emotions and keeps you mindful. The act of drawing becomes a psychological filter—helping you trade from structure, not stress.
3. Why It Beats Indicator Only Trading?
Indicators are reactive. Drawing is proactive.
Here’s the difference:
Indicators show what already happened
Drawing lets you prepare for what could happen
You learn to-:
Anticipate breakouts, fakeouts, and reversals, Understand market structure and Develop your own strategy not depend on someone else's signal. In short you become the strategist, not just a follower.
4. The “Chart Time” Advantage
Just like pilots need flight hours, traders need chart hours. Drawing charts manually gives you those hours.
You start to see patterns that repeat and notice behavior shifts before they show on indicators. Build a visual memory of how the market moves and It’s this visual experience that separates analysts from traders.
5. Real-World Edge: Case Studies
Wyckoff Distribution: Mapping the structure—BC, AR, ST, UT, LPSY—helps anticipate smart money exits.
Gap Zones: Marking an old breakaway gap can help predict future rejection or support
Demand Zones + Fib Confluence: Drawing reveals high-probability reversal zones most indicators miss
Each drawing becomes a trade-ready story with logic and risk control.
6. From Drawing to Discipline
Drawing is not just prep it’s planning. You trade with a clear plan and pre-identified entry/exit zones this reduced emotional interference and It becomes your personal visual rulebook. No noise no randomness just structure driven action.
7. Final Thoughts: The Trader’s Mind vs. The Machine
Yes, AI and indicators are useful.
But your most powerful edge?
Your mind.
Your eyes.
Your experience sharpened through drawing.
If you want to evolve from a reactive trader to a consistent performer, here’s the golden rule:
Stop watching. Start drawing. Trade what you see, not what you hope.
I hope you will like this post, Thanks for giving your valuable time for reading.
Regards- Amit
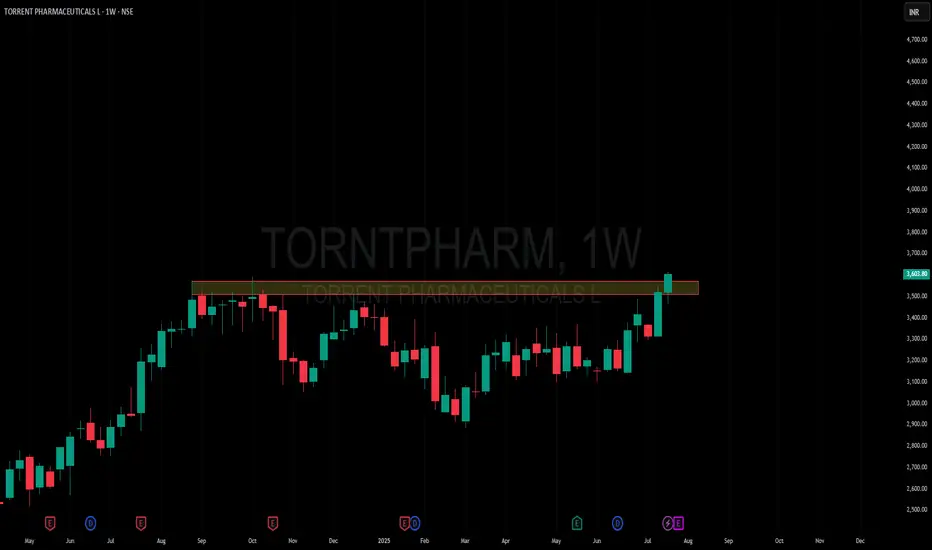
Amazing breakout on WEEKLY Timeframe - TORNTPHARMCheckout an amazing breakout happened in the stock in Weekly timeframe, macroscopically seen in Daily timeframe. Having a great favor that the stock might be bullish expecting a staggering returns of minimum 25% TGT. IMPORTANT BREAKOUT LEVELS ARE ALWAYS RESPECTED!
NOTE for learners: Place the breakout levels as per the chart shared and track it yourself to get amazed!!
#No complicated chart patterns
#No big big indicators
#No Excel sheet or number magics
TRADE IDEA: WAIT FOR THE STOCK TO BREAKOUT IN WEEKLY TIMEFRAME ABOVE THIS LEVEL.
Checkout an amazing breakout happened in the stock in Weekly timeframe.
Breakouts happening in longer timeframe is way more powerful than the breakouts seen in Daily timeframe. You can blindly invest once the weekly candle closes above the breakout line and stay invested forever. Also these stocks breakouts are lifelong predictions, it means technically these breakouts happen giving more returns in the longer runs. Hence, even when the scrip makes a loss of 10% / 20% / 30% / 50%, the stock will regain and turn around. Once they again enter the same breakout level, they will flyyyyyyyyyyyy like a ROCKET if held in the portfolio in the longer run.
Time makes money, GREEDY & EGO will not make money.
Also, magically these breakouts tend to prove that the companies turn around and fundamentally becoming strong. Also the magic happens when more diversification is done in various sectors under various scripts with equal money invested in each N500 scripts.
The real deal is when to purchase and where to purchase the stock. That is where Breakout study comes into play.
Check this stock which has made an all time low and high chances that it makes a "V" shaped recovery.
> Taking support at last years support or breakout level
> High chances that it reverses from this point.
> Volume dried up badly in last few months / days.
> Very high suspicion based analysis and not based on chart patterns / candle patterns deeply.
> VALUABLE STOCK AVAILABLE AT A DISCOUNTED PRICE
> OPPURTUNITY TO ACCUMULATE ADEQUATE QUANTITY
> MARKET AFTER A CORRECTION / PANIC FALL TO MAKE GOOD INVESTMENT
DISCLAIMER : This is just for educational purpose. This type of analysis is equivalent to catching a falling knife. If you are a warrior, you throw all the knives back else you will be sorrow if it hits SL. Make sure to do your analysis well. This type of analysis only suits high risks investor and whose is willing to throw all the knives above irrespective of any sectoral rotation. BE VERY CAUTIOUS AS IT IS EXTREME BOTTOM FISHING.
HOWEVER, THIS IS HOW MULTIBAGGERS ARE CAUGHT !
STOCK IS AT RIGHT PE / RIGHT EVALUATION / MORE ROAD TO GROW / CORRECTED IV / EXCELLENT BOOKS / USING MARKET CRASH AS AN OPPURTUNITY / EPS AT SKY.
LET'S PUMP IN SOME MONEY AND REVOLUTIONIZE THE NATION'S ECONOMY!