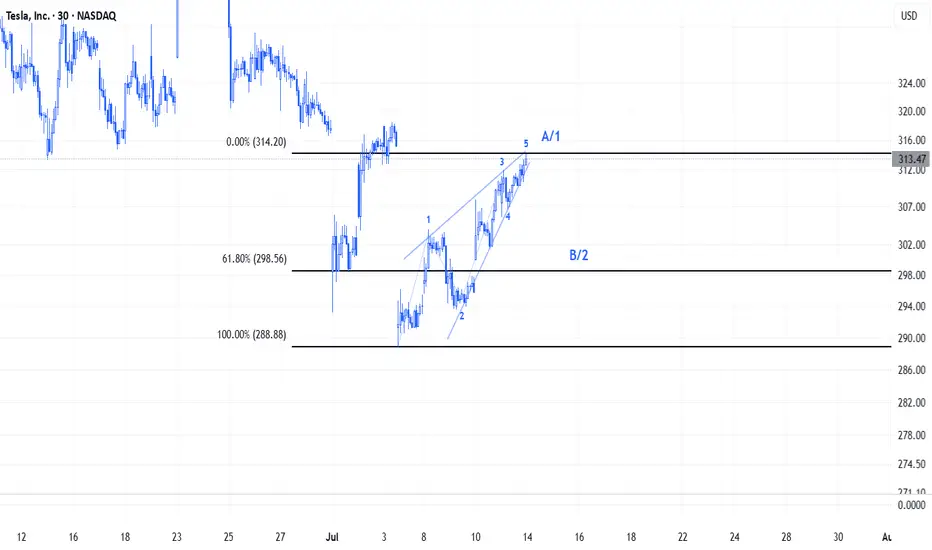
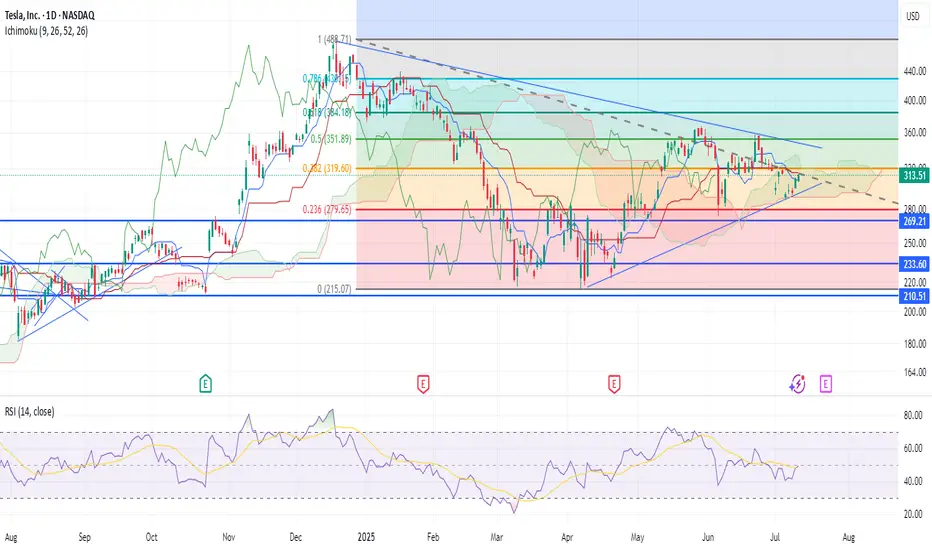
TSLA Elliott Waves We can clearly see that a Leading Diagonal is formed on TSLA's chart.Leading Diagonal usually occurs on Wave A or Wave 1.After this chart pattern, a correction often follows reaching nearly the 61,2% fib levels of the Diagonal
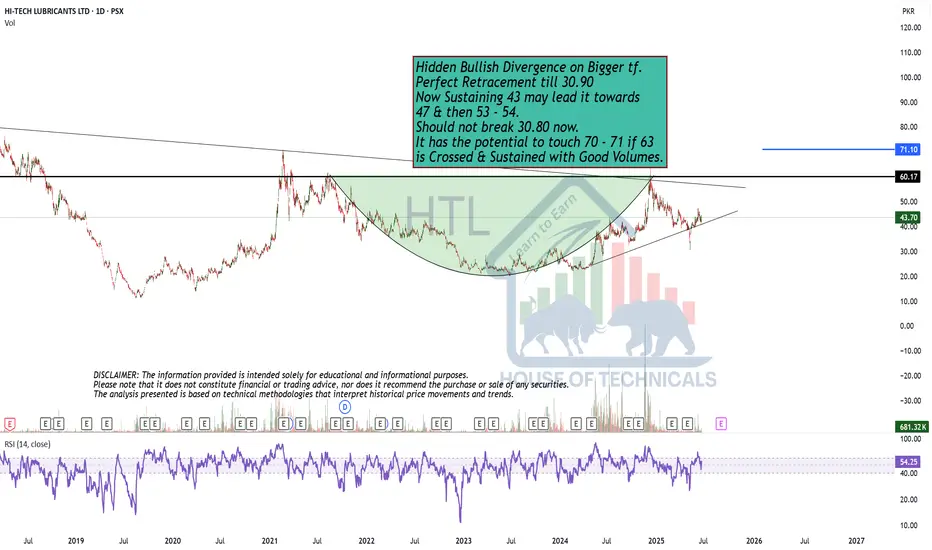
Perfect Retracement till 30.90Hidden Bullish Divergence on Bigger tf.
Perfect Retracement till 30.90
Now Sustaining 43 may lead it towards
47 & then 53 - 54.
Should not break 30.80 now.
It has the potential to touch 70 - 71 if 63
is Crossed & Sustained with Good Volumes.
ABDL looking good Another recent IPO. ABDL, Tightness and the ascending pattern...One big volume candle away from restart of the trend

SAMBHAV STEEL TUBESSAMBHAV STEEL TUBES, WEEKEND TRADE looks good it can give you decent profit in couple of week.

The key is whether it can be supported and rise near 300.17
Hello, traders.
If you "Follow", you can always get new information quickly.
Have a nice day today.
-------------------------------------
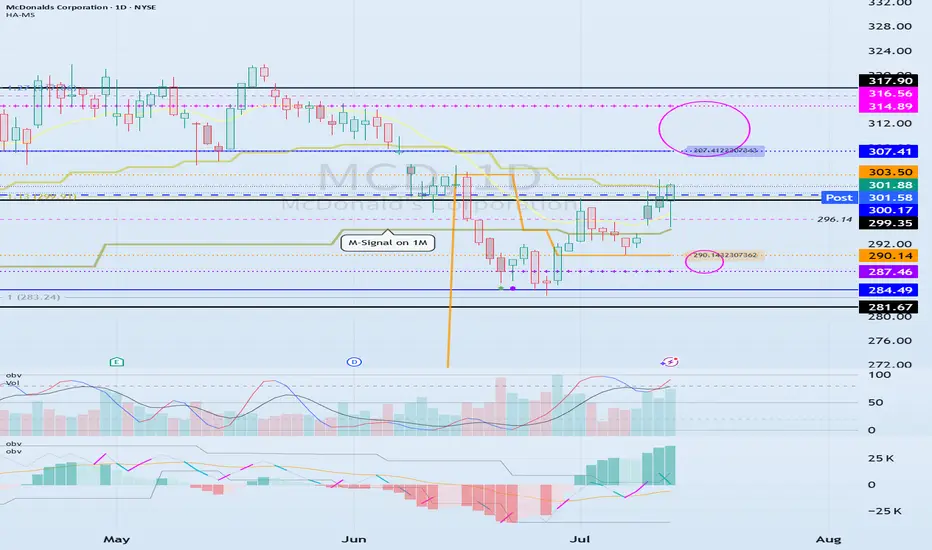
(MCD 1D chart)
Before following the basic trading strategy, the first thing to check is whether the current price is above or below the M-Signal indicator on the 1M chart.
If the price is below the M-Signal indicator on the 1M chart, there is a possibility that it will turn into a medium- to long-term downtrend.
Therefore, if possible, it is recommended to trade stocks whose prices are above the M-Signal indicator on the 1M chart.
If the price is below the M-Signal indicator on the 1M chart, you should respond quickly and briefly using the short-term trading (day trading) method.
-
The support and resistance zones can be seen as the 287.46-290.14 zone and the 307.41-314.89 zone.
The 287.46-290.14 zone is the DOM(-60) ~ HA-Low zone, and the 307.41-314.89 zone is the HA-High ~ DOM(60) zone.
These two zones are likely to form a trend depending on how they break through, so they can be seen as support and resistance zones.
-
The 300.17-316.56 zone is the HA-High ~ DOM(60) zone on the 1W chart.
Therefore, we need to check whether it can receive support and rise in the 300.17-316.56 zone.
Therefore, if it falls near the 307.41-314.89 range, you should check for support near 300.17.
-
If it rises above the HA-High ~ DOM(60) range, it is likely to show a step-up trend, and if it falls in the DOM(-60) ~ HA-Low range, it is likely to show a step-down trend.
-
Thank you for reading to the end.
I hope you have a successful transaction.
--------------------------------------------------
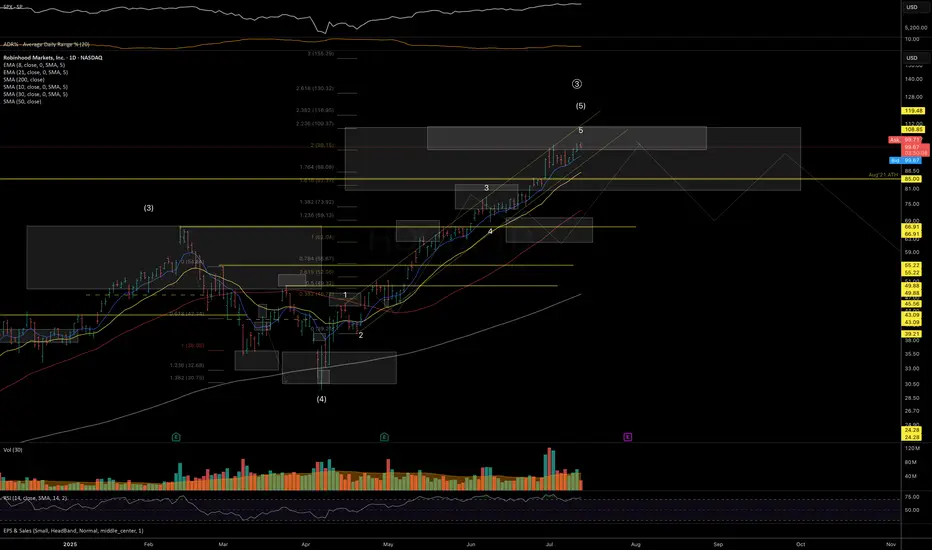
Trade Idea: $HOOD – $106C by 7/25 | Bullish Setup🧠 Thesis:
After topping out at $100, NASDAQ:HOOD pulled back ~10%. I believe this recent pullback sets up a healthy base for a continuation move back toward $100+ in the coming sessions. If momentum kicks in, we could see a push toward the $106 level by expiration.
📊 Key Levels:
Resistance: $95.60 → $97.34 → $99.77 → $102 → $106
Support: $94.00 (uptrend line), $92.97 (higher low), $90.97 (must hold for bulls)
📌 Trade Strategy:
I'm scaling into the $106 Calls expiring 7/25.
Looking for:
A breakout above $97.34 to trigger upside momentum
Profit-taking zones around $99.77 and $102
Final target near $106 (ITM zone)
Risk is managed below $92.97.
🧭 Notes:
Watching broader market sentiment and NASDAQ:QQQ correlation closely. Volume confirmation will be key on any breakout attempts.

#RGTI This pattern is still consolidating within the handle, and a breakout above the resistance could signal the beginning of a new bullish wave.

HOOD — In Key Macro Resistance ZonePrice has reached a major resistance zone, with the 110 level marking an ideal spot where downside pressure may begin to dominate and a mid-term top could start forming. Macro support for the macro-uptrend structure is at the 80–65 area.
Hedging near current levels may be prudent - especially ahead of earnings and while volatility remains relatively cheap.
Weekly view
Daily view:
Thank you for your attention and I wish you successful trading decisions!
Short-term Bear Case for CRCLHello Traders!
As part of my weekly equity trade analysis, I will be uploading my recordings of what I am seeing and intending to trade for the week. A quick summary of what's in the video is as follows:
- CRCL is a high beta stock that seems to not be moving in tandem with its peers as of late
- I am expecting volatility due to market data and monthly options expiration
- CRCL has formed a new bearish order block below another bearish order block and is wedged with a weekly bearish setup. We are anticipating expansion out of this range to the downside
- I am waiting for a re-test of $199-$205 for a full move to $155-$145
Cheers,
DTD

MRVL watch $64.40/43: proven Double Fib holding up the recovery MRVL trying to recover with the chip sector.
Up against a proven Double Fib at $64.40/43.
Look for a Dip-to-Fib or Break-n-Retest entry.

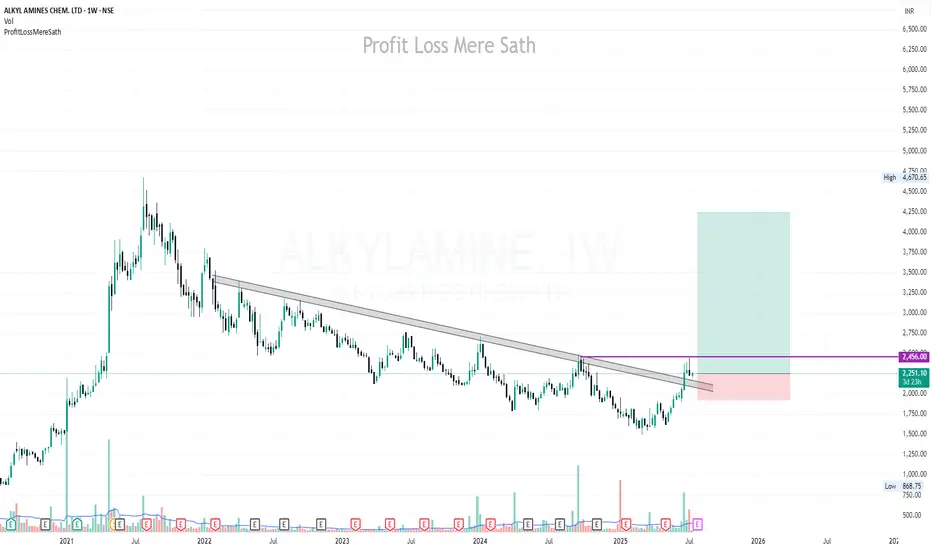
ALKYLAMINE | Buy @LTP | SL below 1900 | Targets 2700, 3440, 4250Disclaimer:
This is not financial advice. Please do your own research or consult with a financial advisor before making any investment decisions. Investments in stocks can be risky and may result in loss of capital.
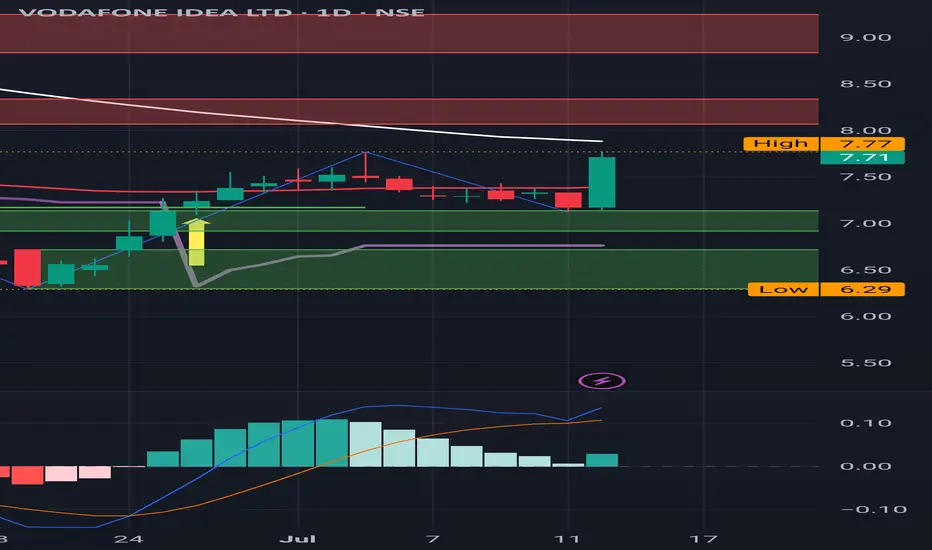
IDEA : Watch out for the Red Band resistances IDEA : Watch out for the Red Band resistances
( Not a Buy / Sell Recommendation
Do your own due diligence ,Market is subject to risks, This is my own view and for learning only .)
TSLA BUY+++ WEDGE FORMING $339 first targetTSLA, like AAPL, is forming a bullish wedge which likely will break to the upside. First target is $339 at wedge resistance then will reevaluate
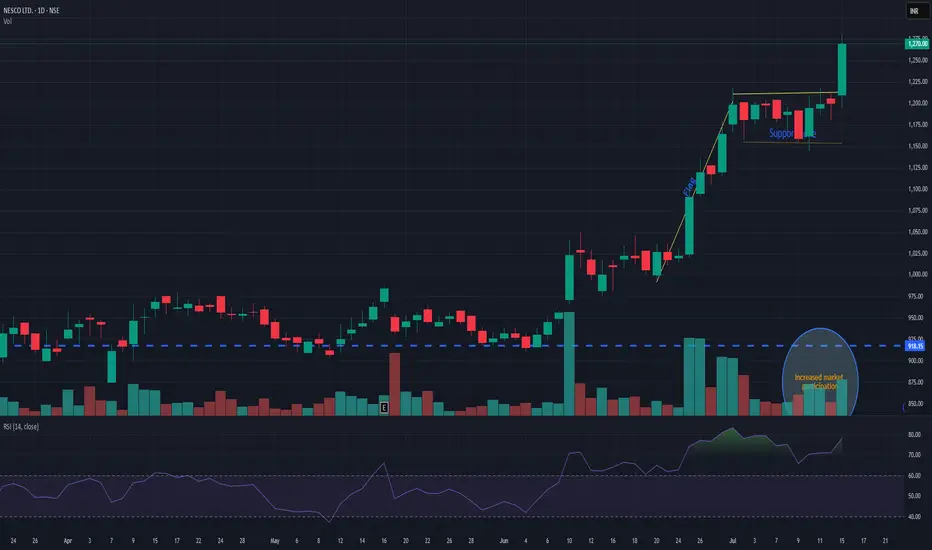
NESCONESCO giving flag pattern breakout with decent volume. Support is seen nr 1180. while pole initiation can be seen near 1010. Currently trading near 1270. It has a potential for new momentum. Keep it on radar.
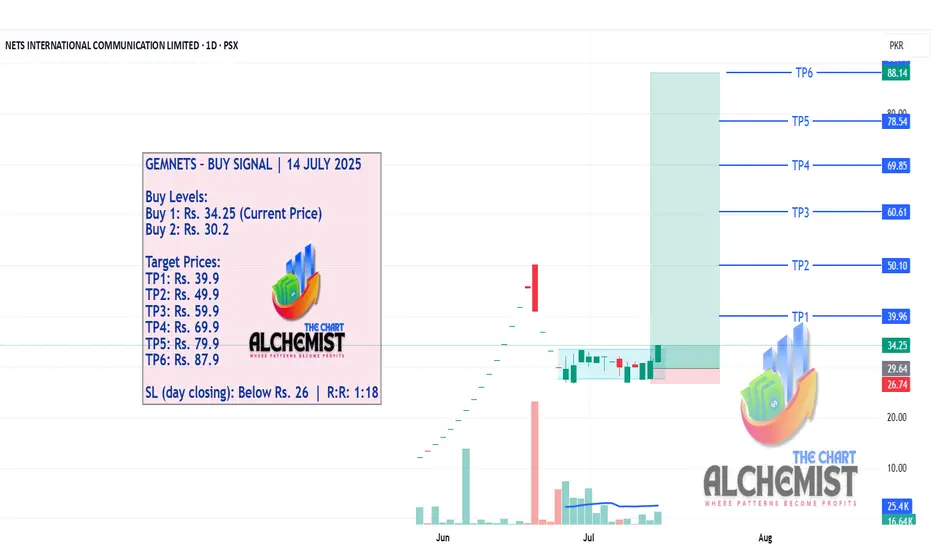
GEMNETS – BUY SIGNAL | 14 JULY 2025GEMNETS – BUY SIGNAL | 14 JULY 2025
After a strong move from Rs. 12 to Rs. 20, GEMNETS entered a pullback phase, which has now transformed into a bullish flag and reaccumulation zone — a powerful structure setting up for another leg higher.
Btcm long position Btcm 5day 1week stocks and Rsi in favor
1hr time frame shows a flag and hidden bullish divergence in my humble opinion 🎇

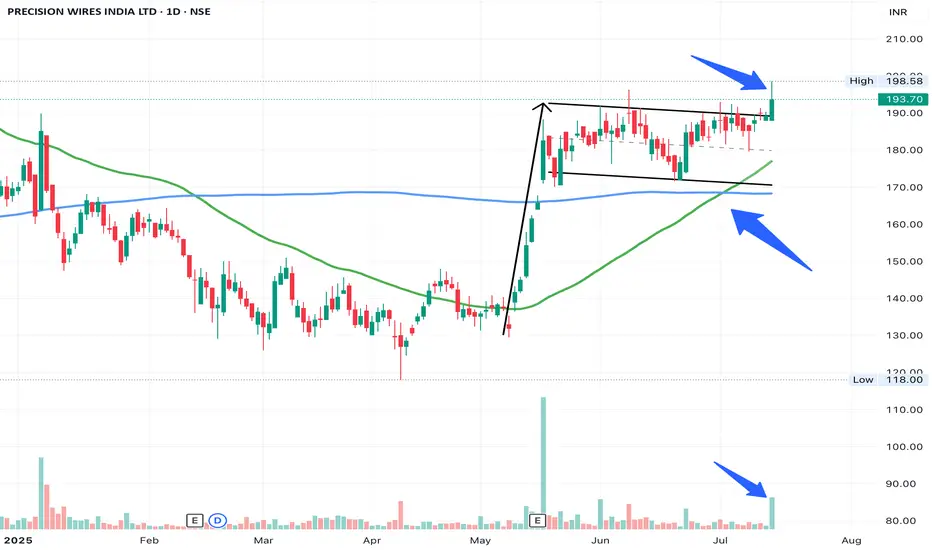
PRECWIRE - Flag and Pole BreakoutFlag and Pole Breakout (needs to sustain till EOD to confirm)
Great Relative Strength and Good volumes.
SL - 170 (partial exit can be done at 180)
Quick View : $ASTSThe daily sees a test of the average EMA21 while the hourly tf already shows up a bullish crossover .
Looking for a new high above that level

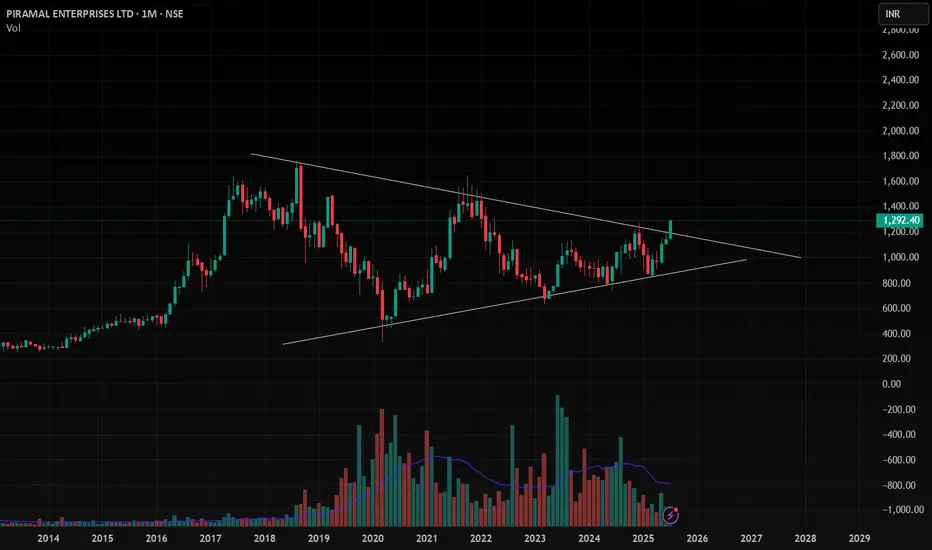
PEL , 1M , BullishThe Triangle Pattern is Breaking Out in Monthly Time Wait for Strong and Perfect close in Weekly Time and Enter after Confirmation .
Take Risk According to your capital
Follow for more ideas like this
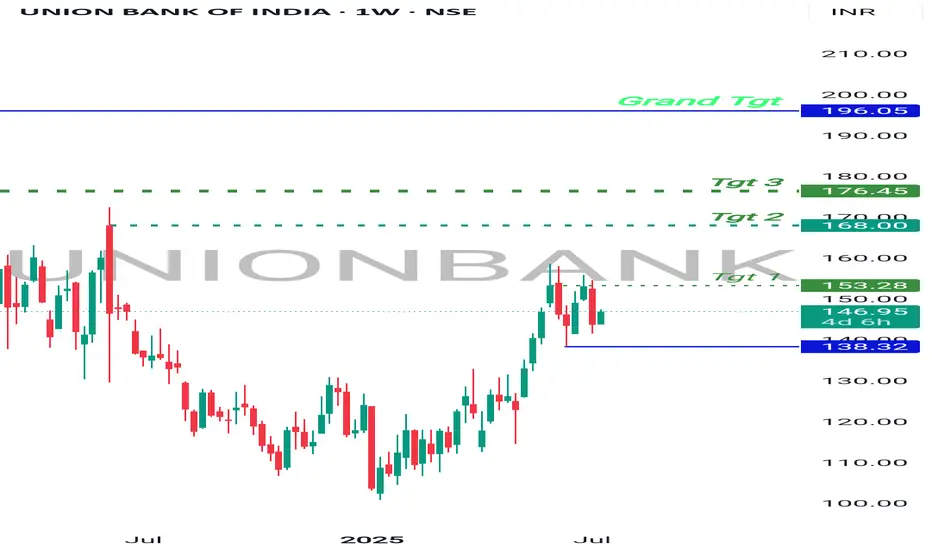
Bullish Bet , UnionBankBanknifty at support.
UnionBank on recent high making sideways moves, which means consolidation.
Once Banknifty Bounce back, UnionBank will break the resistance on weekly and monthly Basis and will start moving higher.
It has higher targets on a short and long term investment.
Good to hold for short term.
MSFT at Gamma Wall Crossroads–Will 506 Break This Time? July 14🧠 GEX and Options Sentiment (TanukiTrade GEX)
* GEX Zone Summary:
* 📈 Call Wall 1 (503.5–506.7) → major Gamma Resistance.
* 🧱 Gamma Wall (506.77) = Highest positive NETGEX — key sell zone for market makers.
* 🟢 GEX Flow: Moderate call dominance (1.95%) — not yet extreme bullish.
* 🟣 IVR 22.8 (low), IVX avg 25.2 – implied vol remains subdued.
* Options Suggestion:
* ⚠️ A move above 506.8 could trigger dealer hedging and gamma squeeze.
* Trade Idea (Bullish):
* Buy 510C or 515C (Jul 19/Jul 26 expiry) on breakout above 507 with volume.
* Stop: <503. Target: 512/516.
* 🚨 If rejection at Gamma Wall (506.8), fade the move:
* Trade Idea (Bearish):
* Buy 500P or 495P on rejection or candle close below 503.
* Target: 497.8 / 494. Stop: 506.5.
📉 1H Technical Trading Plan (Smart Money Concepts)
* Structure:
* Price made CHoCH → BOS toward 506 zone, now consolidating below resistance.
* Minor rejection seen from inside the purple supply box at 506.
* If bulls hold 501–503 zone, could be prepping a second push.
* Key Levels:
* Support: 501.48 / 497.78 / 494.11
* Resistance: 504.46 / 506.77
* Bias:
* 🟢 Bullish above 504.50, expecting breakout toward 510–512.
* 🔴 Bearish below 501.5, likely drop toward 497.8–495.
* Intraday Trading Setup:
* Scalp Long: Entry 504.5–505. Breakout candle confirmation.
* TP: 507. SL: 503.8
* Scalp Short: Entry <501.3
* TP: 498, SL: 503
* Swing Trade Scenario:
* Enter swing calls above 507. Hold for 515+ next week.
* Enter puts only if breakdown below 497.8 with CHoCH back down.
🎯 Final Thoughts:
MSFT is trading tightly below a significant GEX Call Wall, which often leads to a volatile breakout or strong rejection. If bulls push through 507+, we could see a sharp gamma squeeze into 510–515. However, if this fails, price may fade back toward 495–490 zone quickly. Patience at resistance is key.
Disclaimer: This analysis is for educational purposes only and does not constitute financial advice. Always do your own research and manage risk appropriately.

