TITAGARH-EQ has given breakout and will likely retest its high continuing with our railways theme.
TITAGARH-EQ has given a breakout of its resistance channel and will retest its high.
price is has taken support at its strong support zone.
immediate target is around 1250 - 1350 lvls and if fundamentals support it is poised to break its previous high lvls.
as always people are advised to trade as per their risk capacity.

My buy view for NVDAMy buy view for NVDA.
Nvidia has made a significant push up after the meltdown following the new US tariff news.
The push-up is likely cooling off for this baby.
If the current consolidation continues to be sustained by the support zone (TL) in this zone, we are likely to see NVDA rally to $149 and $152 as TP1 and TP2, respectively.
My SL will be around $128.9 zone for both.
RR of 1:4 and 1:4.8
Trade with care

Alibaba (BABA) – Bearish Setup FormingNYSE:BABA
A descending triangle is forming on the chart, with strong resistance around $118 and horizontal support near $102. The structure suggests a potential breakdown, targeting a move of ~−9.8%.
Key observations:
• Price rejected from the descending trendline multiple times
• Stochastic turning down from the overbought zone
• RSI below 50 – room for further downside
• Bollinger Bands show compression, possibly preceding a breakout
📉 Business context:
Alibaba is facing ongoing challenges in its core business. Competition in the e-commerce and cloud sectors has intensified, import/export tariffs are putting pressure on margins, and regulatory oversight from Chinese authorities remains strict. These headwinds may weigh on investor sentiment and stock performance.
My short scenario:
If the price breaks below the $111–$110 zone with volume confirmation, I expect a move toward $102–$100.

TECHNO ELEC & ENG CO. LTD - CUP and Handle Pattern 1DTECHNO ELEC & ENG CO. LTD, Buy Signals by our Private Indicator, and can be trade according to upper resistance line(Yellow) and ADR% (Upper Right Corner).

FedEx LongMy predictions are not investment advises...do your own analysis. I am not responsible for your losses.
The price will go up...to the target area..
If the prediction is correct please boost the idea.

Micron going downMy predictions are not investment advises. Do your own analysis..I am not responsible for your losses..
The price drop will probably start tomorrow or next week...It will take some time to reach the target area...

NUVAMA : Opened a position with 1% riskEntered the position immediately at the close of the strong bullish momentum candle that broke the ATH levels.
📢📢📢
If my perspective changes or if I gather additional fundamental data that influences my views, I will provide updates accordingly.
Thank you for following along with this journey, and I remain committed to sharing insights and updates as my trading strategy evolves. As always, please feel free to reach out with any questions or comments.
Other posts related to this particular position and scrip, if any, will be attached underneath. Do check those out too.
Disclaimer : The analysis shared here is for informational purposes only and should not be considered as financial advice. Trading in all markets carries inherent risks, and past performance is not indicative of future results. It’s essential to conduct your own research and assess your risk tolerance before making any investment decisions. The views expressed in this analysis are solely mine. It’s important to note that I am not a SEBI registered analyst, so the analysis provided does not constitute formal investment advice under SEBI regulations.

NH : An upcoming entry Will be looking forward for an entry in this scrip if price retests the ATH. The entry will be taken with 1% risk. The target levels might vary depending on the momentum in the coming days.
Entry is invalid if the current high is taken out.
📢📢📢
If my perspective changes or if I gather additional fundamental data that influences my views, I will provide updates accordingly.
Thank you for following along with this journey, and I remain committed to sharing insights and updates as my trading strategy evolves. As always, please feel free to reach out with any questions or comments.
Other posts related to this particular position and scrip, if any, will be attached underneath. Do check those out too.
Disclaimer : The analysis shared here is for informational purposes only and should not be considered as financial advice. Trading in all markets carries inherent risks, and past performance is not indicative of future results. It’s essential to conduct your own research and assess your risk tolerance before making any investment decisions. The views expressed in this analysis are solely mine. It’s important to note that I am not a SEBI registered analyst, so the analysis provided does not constitute formal investment advice under SEBI regulations.

NVIDIA Has more room to raise furtherIs it V-Shape pattern ? If Yes, it's definitely ready to go up and possible to hit 199-200

AAPL: Update - Key Levels to Watch for Price DevelopmentAAPL: Update - Key Levels to Watch for Price Development
Overall nothing changed and AAPL remains a valuable and strong structure
Apple's stock (AAPL) has been range-bound between $193 and $212.50 for the past two months, repeatedly testing support near $193 on three occasions.
Each time, the price has rebounded strongly, pushing back toward $212.50—the upper boundary of this trading range.
Given this pattern, the likelihood of another move toward $212.50 remains high.
If AAPL successfully breaches $212.50, it could signal a larger bullish breakout, with upside targets at $224.50 and $240, as highlighted in the chart.
You may find more details in the chart!
Thank you and Good Luck!
❤️PS: Please support with a like or comment if you find this analysis useful for your trading day❤️

One to watchI'm waiting for a higher low to form and entry will be on the following bullish candle.
I'll post more about entry and target when the set up forms, which could be 2-3 weeks

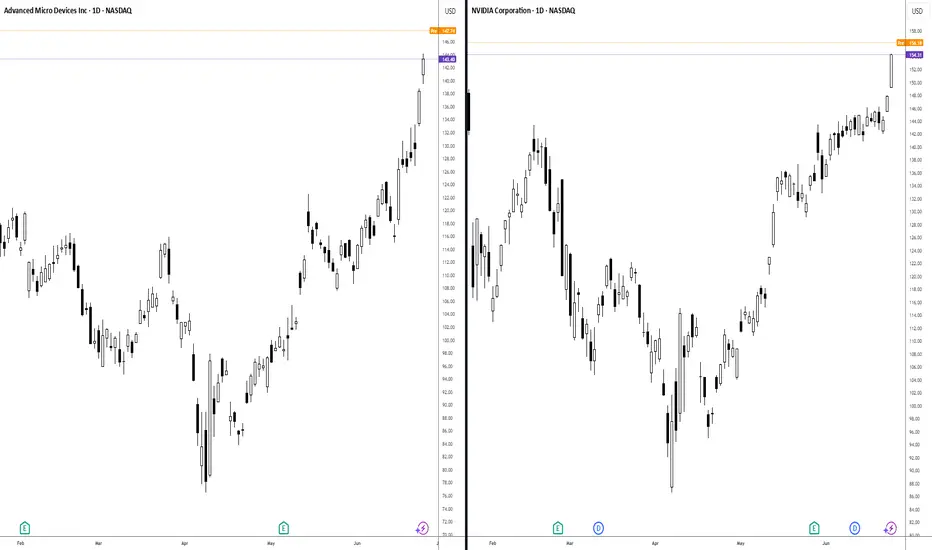
2025/06/25 Portfolio UpdateDue to the fee structure provided by the chosen broker, the fees proportion is too high. The portfolio will only the swing model.
Entry Prices:
AMD - $129.51, 3.0577
NVDA - $152.42, 2.9445
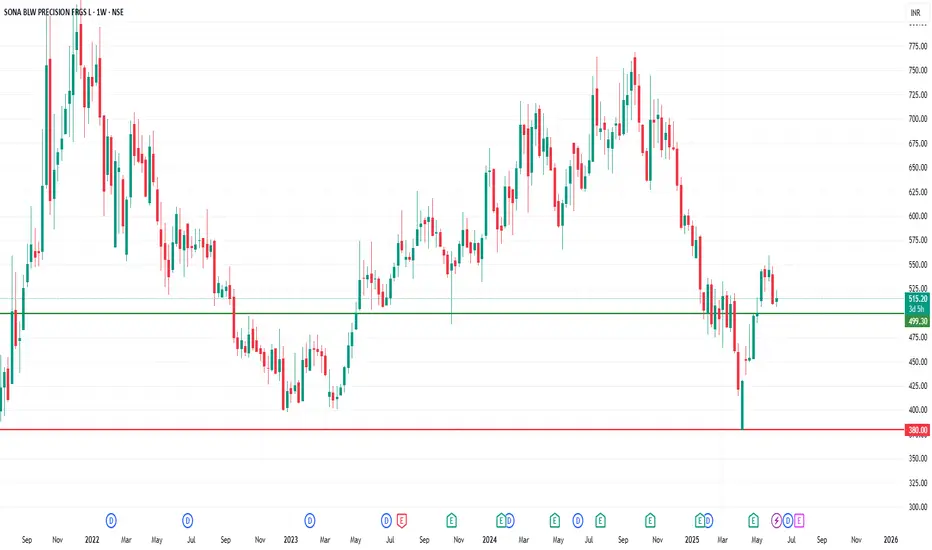
SONACOMSSONACOMS
watch above levels. green line is our entry, redline is our SL.
DISCLAIMER : I am NOT a SEBI registered advisor or a financial adviser. All the views are for educational purpose only.
SOL (Sasol) short term bounce playSasol gapped down on major oil pullback. Looking for a short term bounce of this trendline support level with also potential to close price gap.

BNLI - VCP (11W 21/4 3T)IDX:BNLI - VCP
(+)
1. Low risk entry point on a pivot level.
2. Volume dries up.
3. Price has been above the MA 50 for over 10 weeks, with values exceeding 150, 200, and 300.
4. Price is within 25% of its 52-week high.
5. Price is over 30% of its 52-week low.
6. The 200-day MA has been trending upwards for over a month.
7. The RS Rating is above 70 (98).
8. There has been a significant breakout with substantial volume.
9. The price surged up by 150% and paused only for 24%, indicating a strong uptrend.
10. The stock is the leader of its sector.
**EPS Growth:**
a. Quarterly QoQ: +0.96%.
b. Quarterly YoY: -2.27%.
c. TTM YoY: +34.60%.
d. Annual YoY: +38.06%.
(-)
1. The major market is focused on Danantara and Hilirisasi stocks.


TKG (Telkom) Overbought conditionsTelkom looking overbought with a pullback expected towards trend line breakout support.

$AMAT, Long, TP>10-15%NASDAQ:AMAT , Long, TP>10-15%
Fundamentally the stock is good.
Choose an entry point and do not forget about a protective order if you are trading with leverage.
Don't risk it if you're not sure.
Good luck to everyone.

Positional Setup: Rainbow Children’s Medicare Ltd (NSE)
📍 Chart Analysis Summary
CMP: ₹1513.20
Structure: Strong breakout from a rounded base; retesting previous resistance zones
Volume: Gradual accumulation with spikes on breakout sessions
Momentum: RSI supportive of upside continuation
📊 Technical Levels (Positional Setup)
Support Zones: ₹1435 / ₹1370
Resistance Zones: ₹1575 → then ₹1710
Breakout Confirmation: Price has closed above consolidation zone with momentum
Setup Type: Base breakout + higher lows forming for several weeks
🎯 Positional Targets:
Target 1: ₹1575
Target 2: ₹1710
Target 3 (Extended): ₹1850+
Stop-Loss (Closing Basis): ₹1435

ADP Buy/LongTechnical analysis of the company. According to financial indicators, the company is currently undervalued and is supported by SMA200. The target price for the company is $317.

SOSPrice completing SOS phase of Wyckoff accumulation
Symmetrical triangle almost reached the break point and a strong move will soon happen
I expect an upward move but always set a stop loss to protect your money

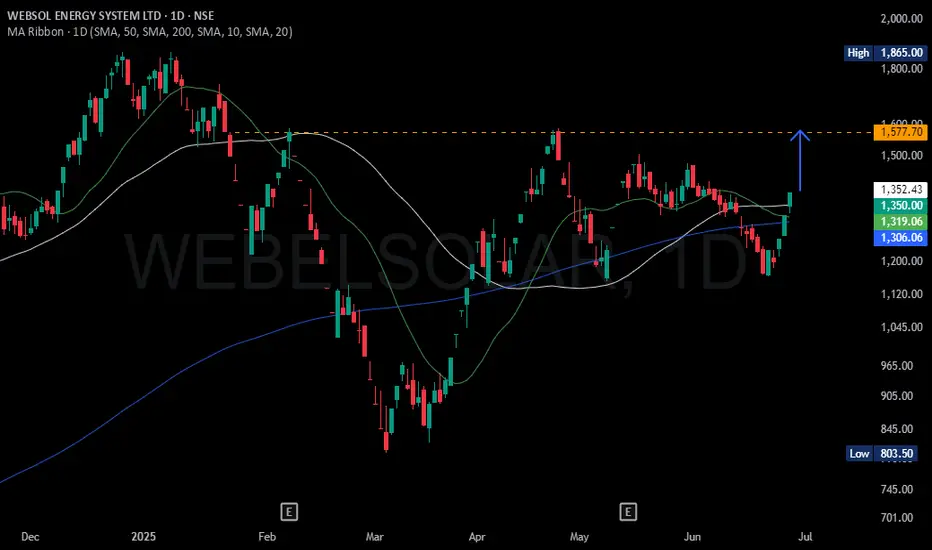
WEBELSOLAR : Heading towards BrakOutWebel Solar, nearing to previous high potential 13% up side from current level and there after break out
Nvidia (NVDA) Share Price Soars to Record HighNvidia (NVDA) Share Price Soars to Record High
Yesterday, Nvidia’s (NVDA) share price surged by over 4%, with the following key developments:
→ It broke through the psychological $150 per share level;
→ It reached a new all-time high;
→ It also contributed to the Nasdaq 100 index hitting a record peak, as we reported earlier this morning.
As a result, Nvidia has reclaimed its status as the world’s most valuable company. Demand for its shares is being fuelled by the CEO’s optimism.
“We have many growth opportunities across our company, with AI and robotics the two largest, representing a multitrillion-dollar growth opportunity,” said Jensen Huang at Nvidia’s annual investor conference.
Technical Analysis of the NVDA Chart
The last three candlesticks reflect strong demand, as:
→ There are bullish gaps between the candles;
→ Lower wicks are either absent or minimal;
→ Candles are closing near their highs with progressively widening spreads.
This suggests strong momentum as the price confidently breaks through the key $150 resistance level. It is reasonable to assume that the current imbalance in favour of buyers around the $146–150 area (highlighted in purple) may form a support zone in the event of a pullback — for instance, within the existing upward channel (shown in blue).
This article represents the opinion of the Companies operating under the FXOpen brand only. It is not to be construed as an offer, solicitation, or recommendation with respect to products and services provided by the Companies operating under the FXOpen brand, nor is it to be considered financial advice.
