Alphabet (GOOGL) Stock Approaches $200 Ahead of Earnings ReleaseAlphabet (GOOGL) Stock Approaches $200 Ahead of Earnings Release
According to the Alphabet (GOOGL) stock chart, the share price rose by more than 2.5% yesterday. Notably:
→ the price reached its highest level since early February 2025;
→ the stock ranked among the top 10 performers in the S&P 500 by the end of the day.
The positive sentiment is driven by expectations surrounding the upcoming quarterly earnings report, scheduled for release tomorrow, 23 July.
What to Know Ahead of Alphabet’s (GOOGL) Earnings Release
According to media reports, Wall Street analysts forecast Alphabet’s Q2 revenue to grow by approximately 11% year-on-year, with expected earnings per share (EPS) of around $2.17 — up from $1.89 a year earlier. Notably, the company has consistently outperformed estimates for nine consecutive quarters, setting a positive tone ahead of the announcement.
Despite the optimism, investors are closely monitoring two key areas:
→ Cloud computing competition , where Google Cloud contends with Microsoft Azure and Amazon AWS;
→ Growing competition in the search sector , linked to the rise of AI-based platforms such as ChatGPT.
In response, Alphabet is significantly increasing its capital expenditure on AI infrastructure, planning to spend around $75 billion in 2025. These investments are aimed at both defending its core search business and advancing the Gemini AI model, while also strengthening Google Cloud’s market position.
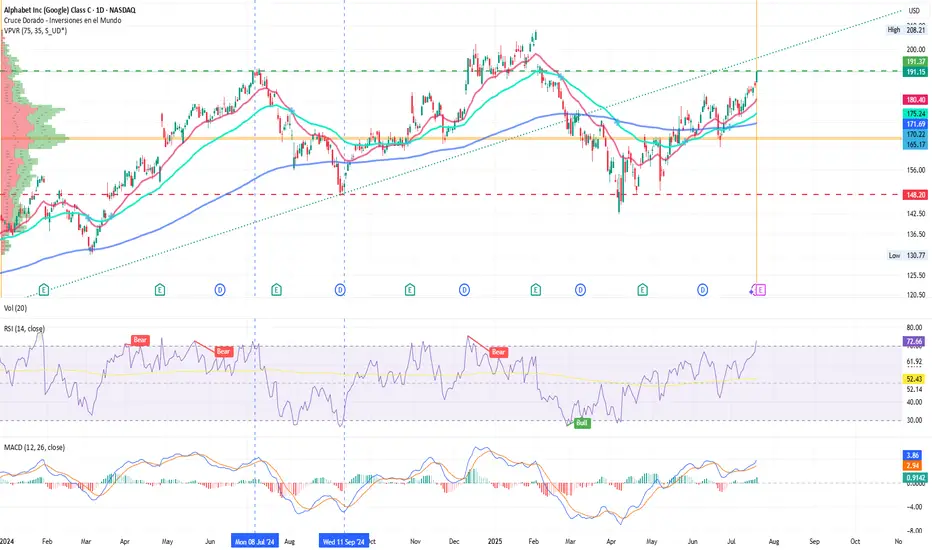
Technical Analysis of Alphabet (GOOGL) Stock
Since April, GOOGL price fluctuations have formed an ascending channel (marked in blue).
From a bullish perspective:
→ the June resistance level at $180 has been breached and may soon act as support;
→ previous bearish reversals (marked with red arrows) failed to gain momentum, suggesting sustained demand is pushing the price higher.
From a bearish standpoint, the price is approaching:
→ the psychological level of $200, which has acted as a major resistance since late 2024;
→ this barrier may be reinforced by a bearish gap formed in early February.
Strong results from the previous quarter, combined with optimistic forward guidance from Alphabet’s management, could provide bulls with the confidence needed to challenge the $200 level.
This article represents the opinion of the Companies operating under the FXOpen brand only. It is not to be construed as an offer, solicitation, or recommendation with respect to products and services provided by the Companies operating under the FXOpen brand, nor is it to be considered financial advice.
Reliance industries on weekly channel support Reliance industries #reliance on weekly channel support. Bullish view
NYKAA<>BreakoutA breakout is occurring with increasing volume. A high-volume close above the 221-222 level would confirm the breakout, potentially from a Cup & Handle pattern.
Keeping on radar.

Denta Water & Infra Solutions Ltd <>Returns Chart shared on July 16th has already yielded a 20%+ return. Analysis suggests the stock should consolidate at its current high level after the recent steep rise, followed by a potential breakout.

4006 Saudi Marketing is a golden chance Fundamentals say that this stock is a golden chance to make lots of money for value investors. I have no doubts about it. You will almost double your money. 😁

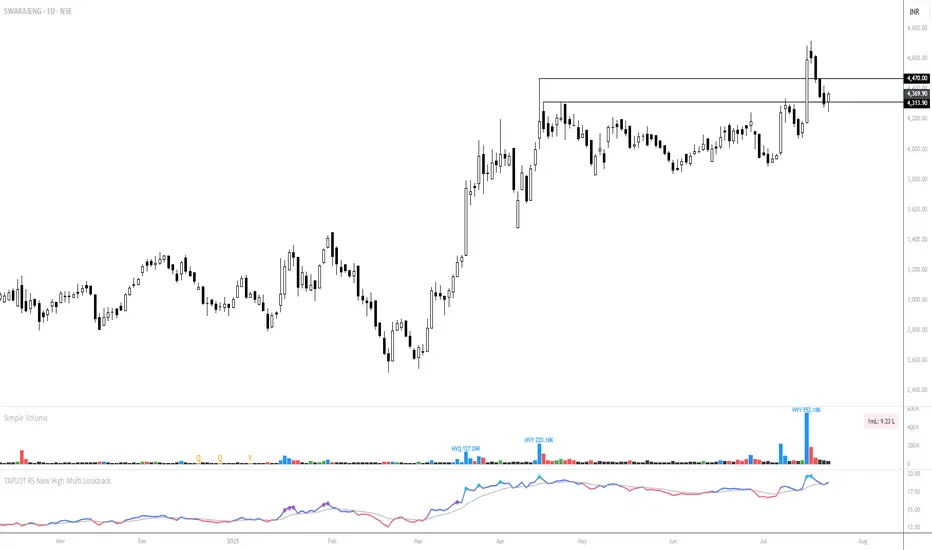
SWARAJENG - Earnings-Driven Breakout & RetestTechnical Overview
Trend: The chart shows a clear upward trend since early 2025. The price consolidated in a tight range for several months before breaking out convincingly.
Breakout: The breakout coincided with a notable spike in volume, indicating strong participation, likely due to robust earnings.
Current Price Action: After the breakout above the 4,313–4,350 resistance zone, the stock surged to fresh highs and is now pulling back, retesting the breakout zone as support.
Technical Setup
Support Levels:
4,350: Recent breakout level, now serving as immediate support.
4,313: Lower boundary of the support zone.
Resistance:
4,490 is the upper part of the breakout zone and the next resistance on upside moves.
Recent high (~4,700): Psychological and technical resistance.
Moving Averages: Price remains above the clustered short-term EMAs, supporting bullish sentiment.
Volume: Heavy buy volume on breakout; lighter volume during the pullback—suggesting selling pressure is mild so far.
Momentum (RSI/TA indicator): Still above the midline, positive but not overbought.
Action Plan
Bullish Scenario:
If price stabilizes and bounces off the 4,313–4,350 support zone—watch for bullish reversal candlesticks (e.g., hammer, bullish engulfing).
Entry: Consider long positions if the stock holds above 4,350 with a clear up-day and renewed volume.
Bearish Scenario:
If price breaks and closes below 4,313 on high volume, expect a deeper retracement (watch for next EMA or previous swing lows as possible supports).
Action: Consider tightening stops or reducing long exposure if the support fails.
Neutral/Wait-and-Watch:
If the price moves sideways or in a tight range near support, wait for clear resolution—either a decisive bounce or breakdown.
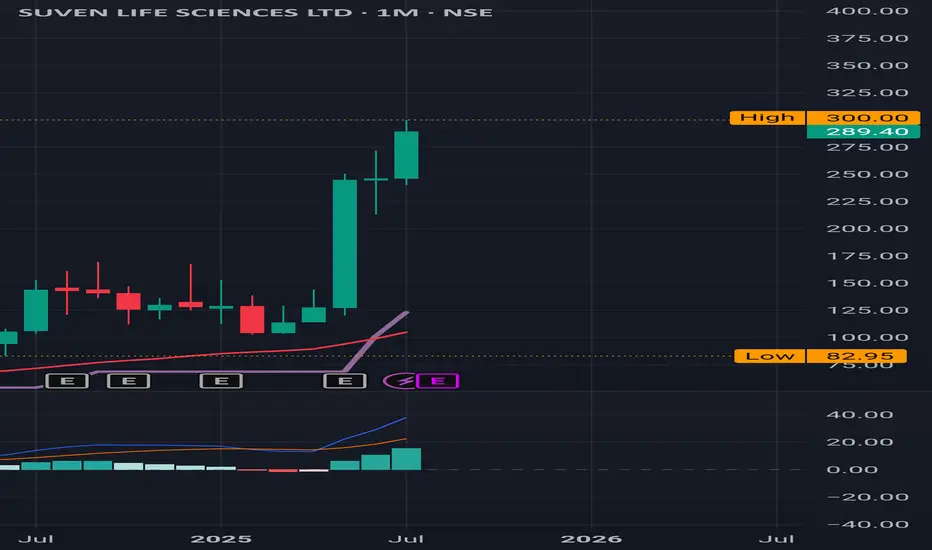
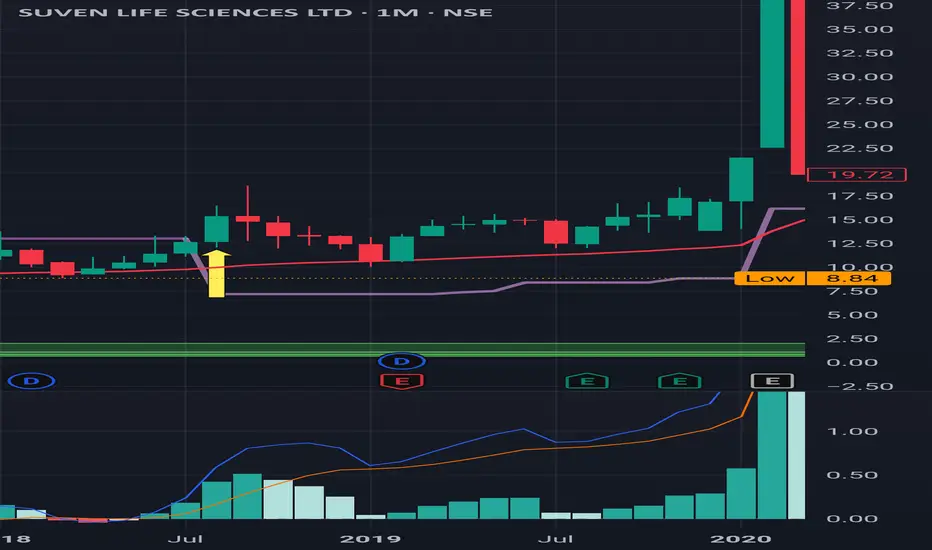
Suven Life Sciences: More than doubled in less than 3 months Suven Life Sciences:
More than doubled in less than 3 months from around 125 in May 2025 to ATH of 300 in July
( Monthly Time Frame )
( Not a Buy / Sell Recommendation
Do your own due diligence ,Market is subject to risks, This is my own view and for learning only .)
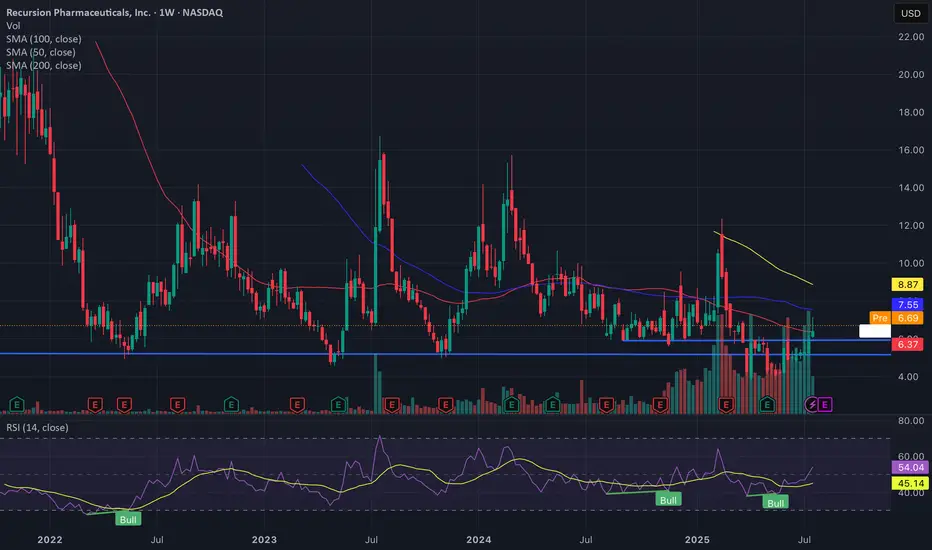
RXRX weekly candle chartIn my previous post yesterday I mentioned the multi year lower support line, the chart on that post was on a much shorter timeframe and didn’t show the support level that I talked about so I thought I’d publish this weekly chart to illustrate what I was talking about.
I also forgot to mention the large increase in the volume of shares traded over the last couple of weeks, this reflects the increase in interest in the company and is generally a positive sign when price is rising as is the case right now.
Pre market is currently indicating a strong opening up 6%, adding to yesterdays gains.
As mentioned yesterday I believe the stock will continue to advance strongly in the coming weeks and months
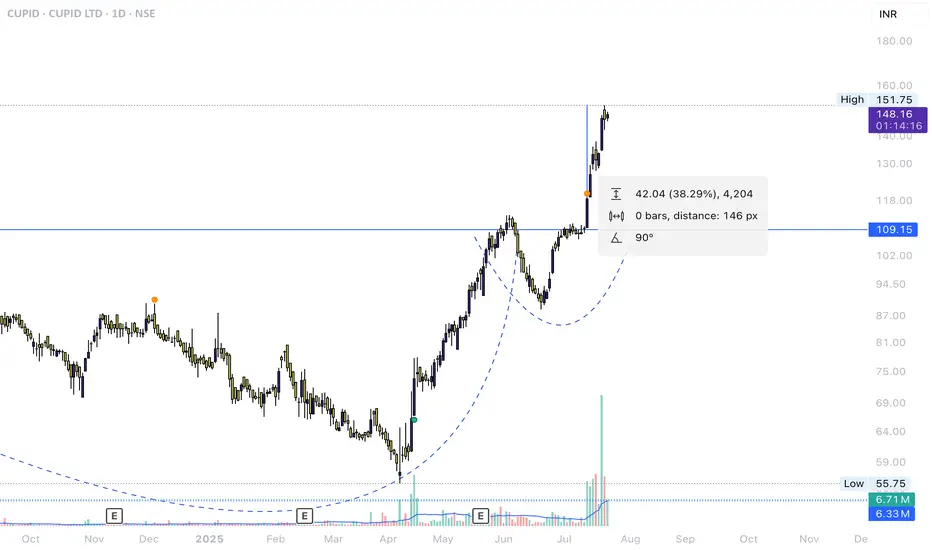
CUPID.NSE ReturnsNSE:CUPID Chart shared idea just 1 week ago.
Breakout trading worked perfectly, More rise can be seen if the stock consolidated near the recent highs and breaksout.
Suven Life Sciences: Monthly Time Frame Suven Life Sciences: Monthly Time Frame
What a Journey!!!
Last time Buy was triggered on August 2018 at around 15 . It's almost 7 years now in August 2025 and it never became a Sell and it has touched 300 .
( Not a Buy / Sell Recommendation
Do your own due diligence ,Market is subject to risks, This is my own view and for learning only .)
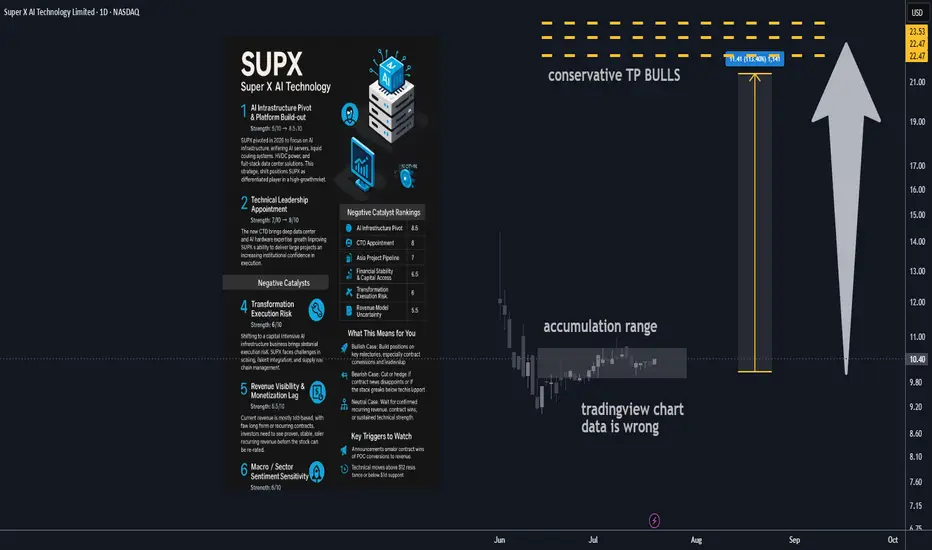
Super X AI Technology Ltd AI Infrastructure Stock 100% upside🔋 1. AI Infrastructure Pivot & Platform Build-out
Strength: 8/10 → 8.5/10
SUPX has made a major pivot in 2025, transitioning from a legacy business into next-gen AI infrastructure. The new focus includes AI servers, liquid cooling systems, HVDC power, and full-stack data center offerings targeting the rapidly growing demand for AI compute in Asia. This shift positions SUPX as a differentiated player in a high-growth market, opening doors to larger contract values and broader verticals.
________________________________________
🤖 2. Technical Leadership Appointment
Strength: 7/10 → 8/10
A major recent step forward is the hiring of a seasoned CTO with deep data center and AI hardware experience. This upgrade significantly enhances SUPX’s execution ability and credibility in enterprise infrastructure. Institutional investors and potential partners will see this as a sign SUPX can deliver on its technical roadmap and close major deals.
________________________________________
📈 3. Asia Institutional Partnerships Pipeline
Strength: 6.5/10 → 7/10
SUPX is developing a solid pipeline of institutional AI infrastructure projects across Asia, especially with established banks and tech companies. While many projects are still in proof-of-concept or pilot stages, these early relationships can drive high-margin, recurring business if successfully converted to long-term contracts.
________________________________________
💰 4. Capital Structure & Financial Health
Strength: 6/10 → 6.5/10
The company’s cash position has improved after new equity raises, giving SUPX a runway for continued R&D and expansion. While the business is still operating at a loss and share dilution remains a factor, debt levels are manageable and financial flexibility should support continued transformation and growth.
________________________________________
________________________________________
⚠️ Negative Catalysts
🛠️ 5. Transformation Execution Risk
Strength: 6/10 → 6/10
Transitioning from a legacy model to a complex, capital-intensive AI infrastructure business brings substantial execution risk. SUPX must navigate operational scale-up, talent integration, and supply chain challenges, with no guarantee of seamless delivery. Any delays or setbacks could erode investor confidence.
________________________________________
🌐 6. Revenue Visibility & Monetization Lag
Strength: 5.5/10 → 5.5/10
Most current revenue is still pilot-based, with few long-term or recurring contracts secured. The business model relies on successful conversion of its pipeline and faster ramp-up in recognized sales. Investors will need to see evidence of stable, recurring revenue before the stock is re-rated.
________________________________________
🔁 7. Macro / Sector Sentiment Sensitivity
Strength: 5/10 → 5/10
As a small-cap AI/infra play, SUPX is highly exposed to swings in broader market sentiment. Any downturn in tech or risk-off moves in global markets could lead to outsized stock volatility, regardless of execution progress.
________________________________________
________________________________________
🚀 Refreshed Catalyst Rankings
Rank Driver Score
1 AI Infrastructure Pivot 8.5
2 CTO Appointment (Execution) 8
3 Asia Project Pipeline 7
4 Financial Stability & Capital Access 6.5
5 Transformation Execution Risk 6
6 Revenue Model Uncertainty 5.5
7 Macro / Sector Volatility 5
________________________________________
📊 Analyst Ratings & Price Outlook
• No major Wall Street coverage; visibility remains driven by news flow and early institutional/retail adoption.
• Technicals: The stock has established higher lows since its business model pivot. Resistance sits near $11.50–12, with support at $9.80–10.00.
• Price target: A $20 target remains plausible if SUPX delivers on growth milestones and secures new capital or contracts, representing a potential doubling from current levels.
________________________________________
🗞️ Recent Developments
• Hired a proven CTO to drive the new AI/data center focus.
• Company rebranded and fully pivoted its business model in 2025, shifting all resources to AI infrastructure.
• Implemented a new equity incentive plan to attract and retain top tech talent.
• Announced a robust pipeline of institutional projects across Asia, although most are not yet recognized as revenue.
________________________________________
🔍 Summary Outlook
SUPX is an emerging transformation play, now fully aligned with surging demand for AI infrastructure. Its success depends on management’s ability to scale, close institutional contracts, and prove out recurring revenue. While the story is compelling and early traction is positive, the company remains high-risk and execution-dependent at this stage.
Bull Case:
If SUPX converts pilots into revenue, delivers operationally, and continues to attract top talent, the stock could re-rate to the $15–20+ range as its business model is validated.
Bear Case:
Stumbles in execution, monetization, or funding could send the stock back to $7–8 support.
Neutral:
Many investors may choose to wait for confirmation of contract wins, recurring revenue, or sustained technical strength before committing.
Technical Levels to Watch:
• Bullish breakout if it clears and holds $11.50–12.00.
• Bearish risk if it fails to hold $9.80–10.00, with possible drop toward $8.
________________________________________
✅ What This Means for You
• Bullish: Build positions into execution milestones, focusing on contract conversions and leadership updates. Upside potential to $20 if catalysts align.
• Bearish: Cut or hedge exposure on failed contract news or technical breakdown.
• Neutral: Stay on the sidelines until more evidence of recurring revenue, confirmed contract wins, or positive sector momentum.
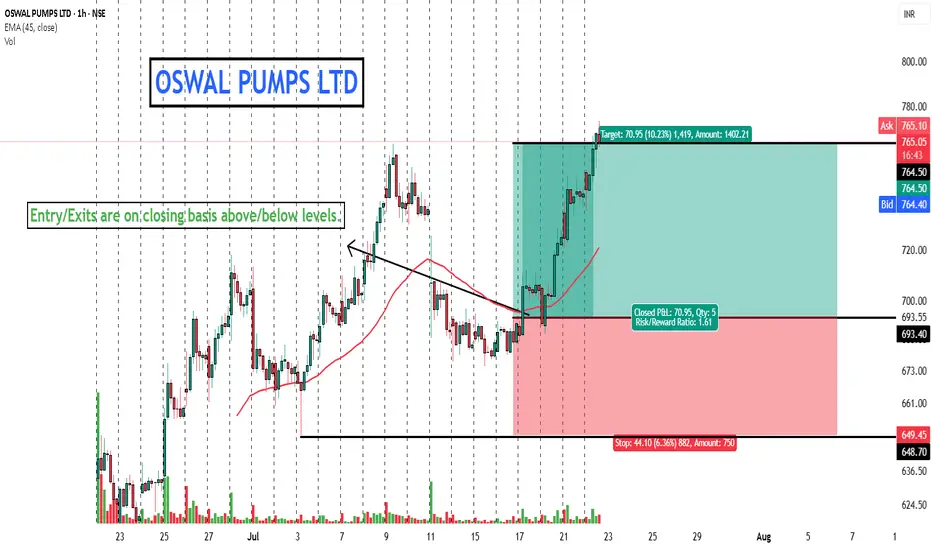
OSWALPUMPS - Target Reached -Shared a While Ago - Closing.Shared this stock a while ago here in the community.
I am Abhishek Srivastava | SEBI-Certified Research and Equity Derivative Analyst from Delhi with 4+ years of experience.
I focus on simplifying equity markets through technical analysis. On Trading View, I share easy-to-understand insights to help traders and investors make better decisions.
Kindly check my older shared stock results on my profile to make a firm decision to invest in this.
Kindly dm for further assistance it is for free just for this stock.
Thank you and invest wisely.
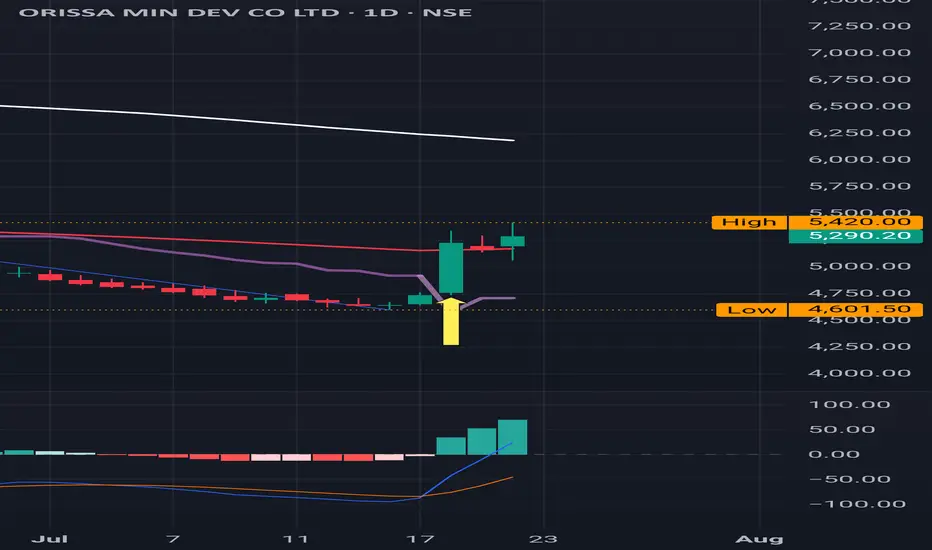
OMDC : Buy Triggered OMDC : Buy triggered .
Still under 200 SMA which could be an important level to test.
( Not a Buy / Sell Recommendation
Do your own due diligence ,Market is subject to risks, This is my own view and for learning only .)
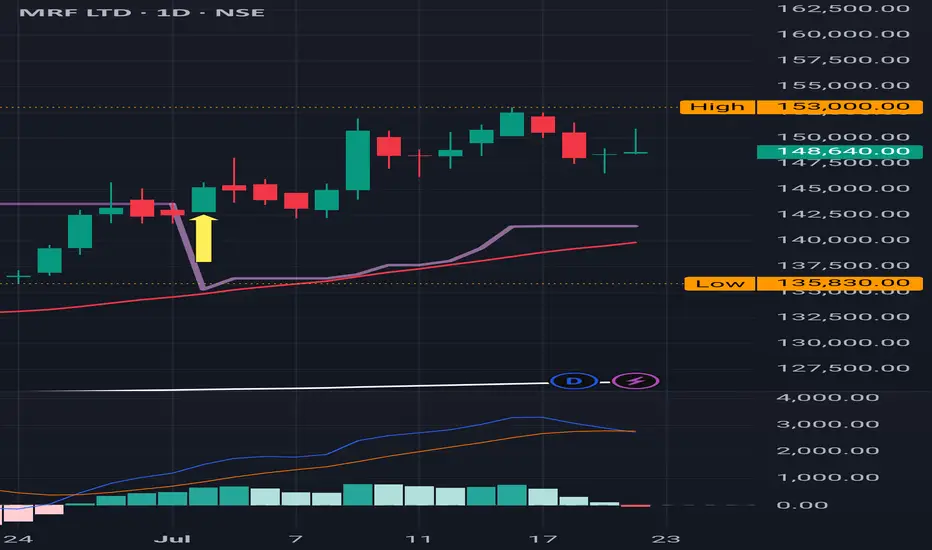
MRF : After a Buy Signal, made it to ATH MRF : After a Buy Signal, made it to ATH .
( Not a Buy / Sell Recommendation
Do your own due diligence ,Market is subject to risks, This is my own view and for learning only .)
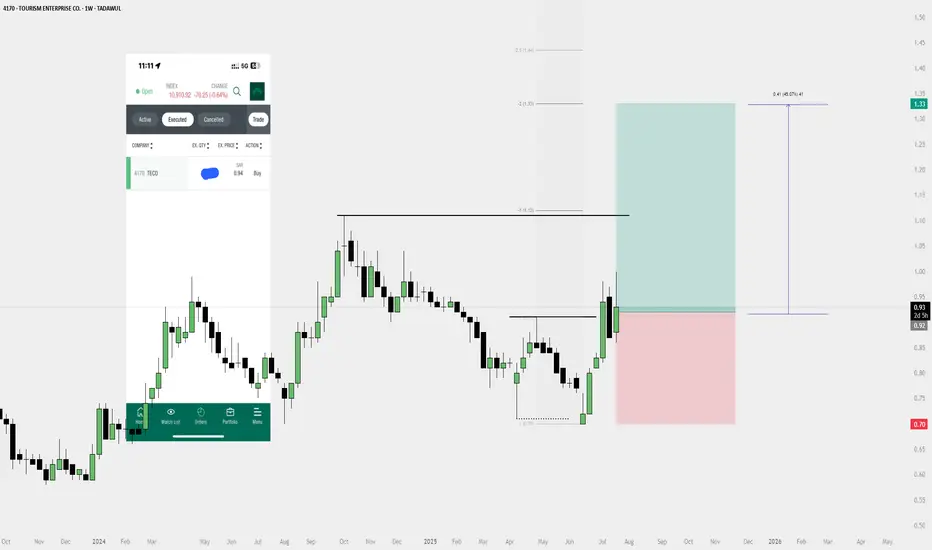
Weekly Buy Plan – 4170 (Tourism Enterprise Co.)📈 Weekly Buy Plan – 4170 (Tourism Enterprise Co.)
Bias: Bullish
Entry: 0.93
Stop Loss: 0.70
Target: 1.33 (2R)
Target Gain: +45%
Reasoning:
✅ Weekly structure break
✅ Bullish FVG respected
✅ Strong impulse move
✅ Pullback to FVG + BOS = High-probability setup
Holding for higher timeframe continuation. Invalidation below 0.70.
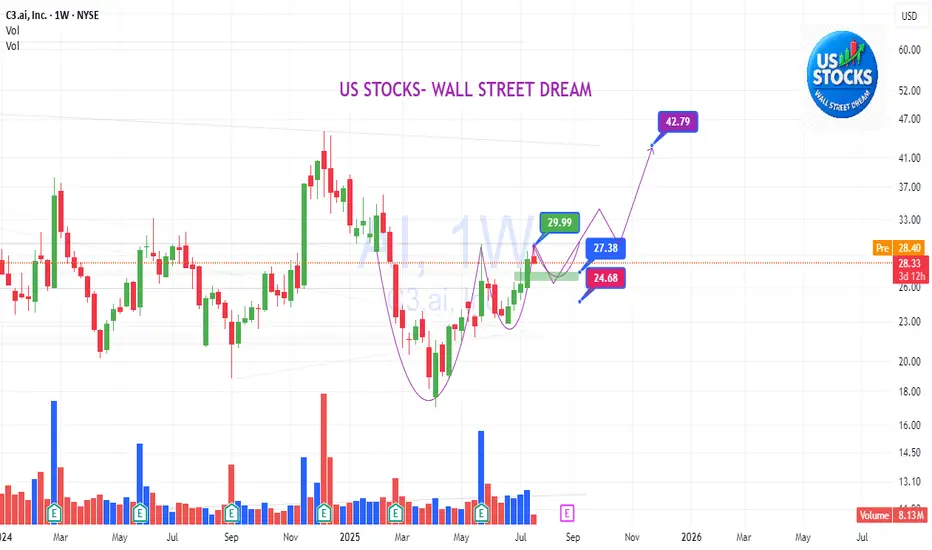
AI: Another accummulation swing round before a new journeyAI:
.
Another accummulation swing round before a new journey.
VCP pattern.
Less supply vol at the end of the accumultion range.
.
US STOCKS- WALL STREET DREAM- LET'S THE MARKET SPEAK
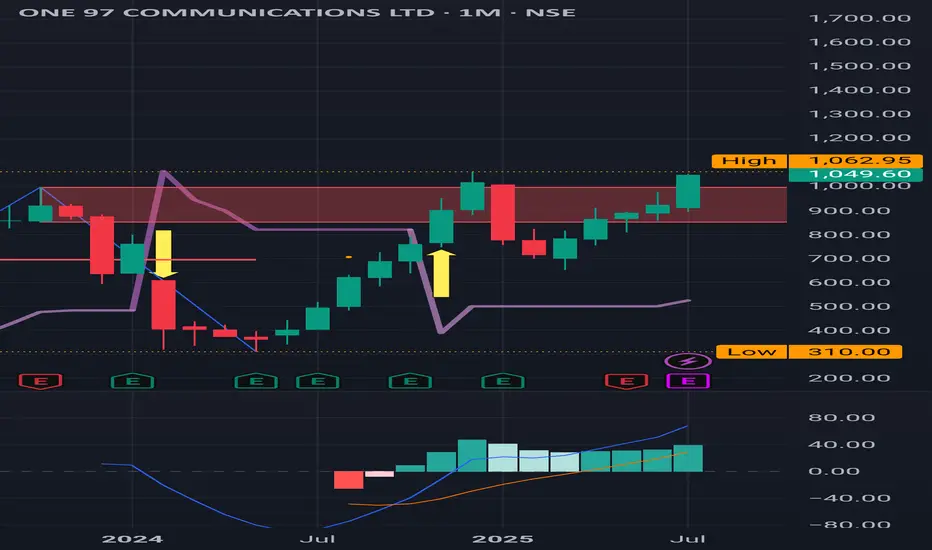
Paytm : Monthly Time Frame, Sitting at a major Red Band Resistan
Paytm : Monthly Time Frame, Sitting at a major Red Band Resistance.
Last timr it turned back from 1062 , very important level to test .
( Not a Buy / Sell Recommendation
Do your own due diligence ,Market is subject to risks, This is my own view and for learning only .)
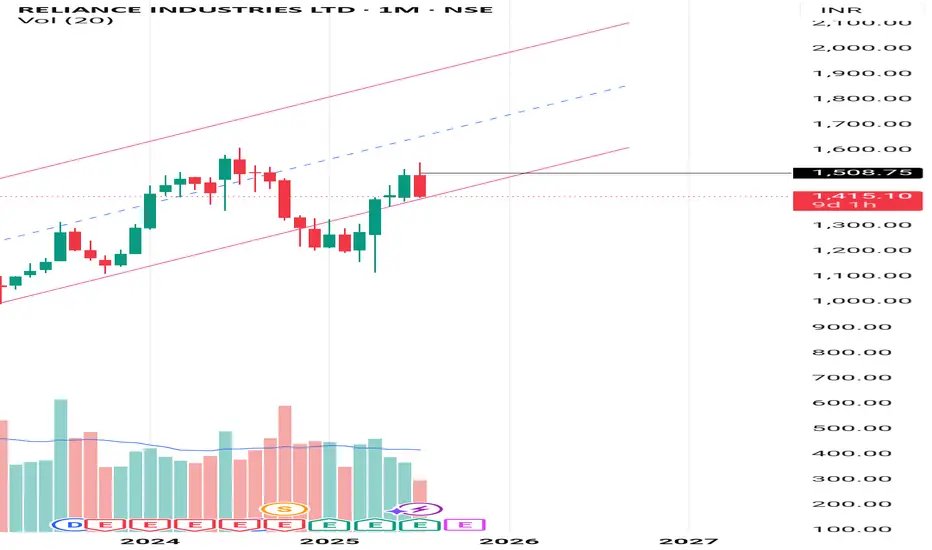
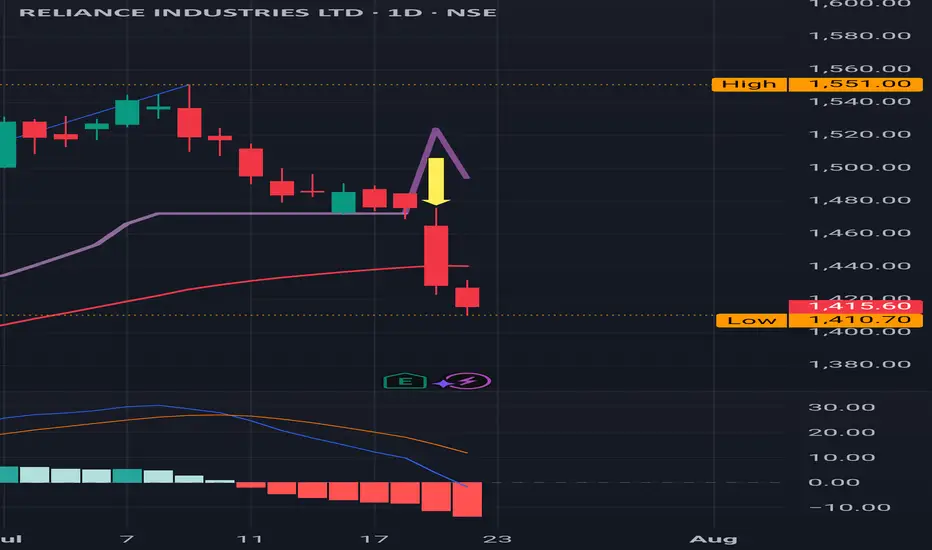
REL : Sell Triggered , around 1400 is an important support levelREL : Sell Triggered .
1390 to 1400 is an important support level.
( Not a Buy / Sell Recommendation
Do your own due diligence ,Market is subject to risks, This is my own view and for learning only .)
Nio - Best caseHere my best term scenario on Nio
We may have bottomed out as we have started to see bullish price action but tread with caution. once we have candle closure on weekly above that weekly breaker block i am looking ath this level to be our launchpad higher with the best case; is that we reach our long term target between 25-37

VZ: Verizon stock update after earningsVerizon jumped on positive results, which aligned with my bullish view on it.
Tomorrow will have its competitors T-Mobile & AT&T earnings result, this will update us on the industry as well. Most probably that I will go long on it in the next 24Hr.
Disclaimer: This content is NOT a financial advise, it is for educational purpose only.

Isp - one of the best ! I've been following Intesa Sanpaolo closely for years.
I started out as an observer, then became a dedicated analyst, and eventually it turned into an investment opportunity.
Between 2018 and 2020, I bought and sold the stock several times, always guided by objective analysis and medium-term strategies.
Over time, I’ve shared my research with more than 2,000 people, many of whom have purchased my studies and used them to inform their own financial decisions.
After nearly 18 years the stock could realistically return above €5. This wasn’t a personal wish, but rather the result of a rigorous analysis of financial statements, management strategy, and long-term technical market patterns.
Financial Performance 2022–2024: Solid and Consistent Growth
✦ 2022
Net profit: €4.35 billion
Despite the inflationary environment, the Group maintained a solid structure, supported by revenue diversification and the resilience of its core business.
✦ 2023
Net profit: €7.7 billion
Growth was driven by a sharp increase in net interest income and strong cost discipline. Dividend payouts increased, further boosting investor appeal.
✦ 2024
Record net profit: €8.7 billion
Net interest income grew by 6.9%, and the cost/income ratio remained around 52%. The bank confirmed its ability to deliver strong results even in complex market conditions.
Outlook for 2025 and Beyond: Sustainable Growth and Strong Shareholder Returns
Guidance for 2025 includes:
Expected net profit > €9 billion
Expansion in core sectors (wealth management, insurance, digital innovation)
Over €4 billion in technology investments
A strategy focused mainly on organic growth, with a cautious approach to extraordinary operations
In Q1 2025, the bank reported a net profit of €2.6 billion (+14% YoY), with an exceptionally low cost/income ratio of 38%.
In addition to operational growth, Intesa Sanpaolo continues to pursue a generous dividend and buyback policy, supported by one of the strongest capital positions among European banks.
This is a financial technical study and not a financial advise. Please do your own research before make any decision.

Silicon Valley Shaken by China’s Free AI OffensiveSilicon Valley Shaken by China’s Free AI Offensive
By Ion Jauregui – Analyst at ActivTrades
Artificial intelligence is undergoing its first major geopolitical fracture. While OpenAI strengthens its infrastructure by renting servers from Google Cloud, China’s advance with free generative models threatens to redefine the balance of power in the sector. Names like Qwen, InternLM, Yi, Baichuan, ChatGLM, or Ernie Bot (from Baidu), as well as initiatives backed by Tencent, Alibaba or iFlytek, are emerging strongly. Many of these open-source models already match — and in some tasks outperform — DeepSeek and compete with giants like GPT-4. A new global chessboard is being drawn with direct consequences for Alphabet, owner of Gemini and the same cloud service now supporting its main rival.
Google’s parent company has once again bared its teeth. Alphabet published second-quarter 2025 results that comfortably beat market expectations. Revenues are rising, profitability is solid, and its financial strength allows it to buy back shares at a dizzying pace. But behind all the shine, one shadow remains: its bet on artificial intelligence, Gemini, still hasn’t taken off compared to ChatGPT — and now faces a tsunami of free AI coming from China.
China’s Free AI Offensive: Intelligence for All (Without Paying)
The latest developments unveiled by Beijing are setting off alarms in Silicon Valley. Models like InternLM2, Qwen2, and Yi are not only distributed freely but show results equivalent or superior to paid models in key natural language tasks. Trained with massive corpora and backed directly or indirectly by the state, these AIs are designed to scale in universities, startups, and local companies, replacing Western software at no cost and with open licenses. The open-source ecosystem, combined with a local (albeit limited) chip market, allows China to reduce dependence on the West while exporting influence to emerging markets like Central Asia, Africa, or Latin America.
Xi Jinping Hits the Brakes… or Does He?
Since Xi Jinping’s speech calling for “moderation” in public investment in sectors like AI or electric vehicles, the message seems more like an attempt to control bubbles than halt progress. The president was clear: “Not the entire country should be building cars or processing data.” With irony, he labeled local governors as “three-pat officials”: one on the head to get the idea, one on the chest to sell it, and one on the backside to run when it blows up. Elegantly Brutal Comment. Behind the humor lies a serious backdrop: inflated bubbles, centers without qualified staff or functioning chips, and falsified sales data. This isn’t surprising given China’s price wars in the auto sector and shady practices inflating sales through vehicles insured before actual purchase, which has triggered a wave of new regulations and controls. This war has spread to AI, with centers being built without skilled personnel or working chips. According to Xi, unchecked growth is not worth it if it means excessive corporate and state debt.
OpenAI Rents Google Servers: Strategic Move or Dependence?
In an unexpected twist, OpenAI has started using Google Cloud infrastructure. The paradox is clear: Google, a direct rival with Gemini, is now supporting the race leader. The move seems pragmatic: OpenAI needs scale, and Google has one of the world’s most powerful cloud networks. This could translate into meaningful revenue for Alphabet, at the cost of ceding leadership perception in AI.
From a strategic standpoint, integrating into OpenAI’s service ecosystem could win Alphabet a long-term technological and economic victory by boosting cloud revenues and indirectly funding Gemini.
Alphabet Analysis (GOOGL)
🤖 Gemini, the Eternal Contender?
The paradox is clear: by using Google Cloud — one of the world’s most powerful cloud services — OpenAI generates income for Alphabet. Meanwhile, Alphabet still struggles to differentiate itself in generative artificial intelligence. Gemini continues searching for its place. Despite being one of Alphabet’s boldest bets, its progress has been slow and adoption lukewarm, and it hasn’t yet delivered significant returns on its own. Gemini has yet to achieve massive direct monetization. While integrations with Google Workspace — Gmail, Docs, and the Android ecosystem — are gaining visibility, user perception is still dominated by OpenAI. And now, with the emergence of free Chinese AIs, Gemini may be pushed aside even in markets where Alphabet aimed to lead digital transformation, like India, South America, or parts of Eastern Europe.
This alliance with OpenAI may have a mixed impact: positive on revenues, but negative for perceptions of technological leadership. Meanwhile, the market is watching open-source models like Qwen2, InternLM2, and Yi from China — all free — gain traction in sectors once reserved for the West. In the short term, this may seem like a trade-off, but from a strategic viewpoint, it could be one of Alphabet’s key long-term business moves. Alphabet has historically invested in competitors and made key acquisitions to reinforce its ecosystem — this could be one of those strategic bets, helping to fund Gemini’s path toward long-term tech leadership. Especially considering that in Q1, it increased R&D spending — particularly in AI and quantum computing — and that the cloud business must sustain its operating profitability (which grew 25% in Q1), this move could provide essential capital for this critical business vertical. Alphabet posted $33.8 billion in Q1 revenue, with total operating margins around 28%. AI as a future lever: Gemini 2.5 Pro and AI Overviews, already with 1.5 billion monthly users, could be catalysts accelerating multiple products.
A (Nearly) Perfect Quarter
Alphabet posted $93.84 billion in revenue in Q2 2025, a year-on-year growth of +10.7%. Net income reached $26.5 billion, with estimated EPS at $2.18. Operating margins improved to 34% (up from 32.4% in Q2 2024), reflecting more efficient management, while other Big Tech players have opted for cuts. One key standout was Google Cloud, which grew over 25% YoY ($12–13.1B), consolidating its profitability and strengthening its role as Alphabet’s second-largest revenue stream behind advertising.
Is Advertising Still the Engine?
Ad revenues rose by a solid +8.5%, reaching nearly $67 billion, with YouTube and Google Search leading the recovery (~$52–53B). Alphabet shows that even in disruptive times, its model continues generating cash.
Regulatory Risks
Growing antitrust pressure (Chrome, search case) with upcoming decisions could impact its business model and valuation.
Massive Buyback and Strong Cash Position
Alphabet isn’t just earning — it’s returning value to shareholders. The company announced a $70 billion share buyback, showing confidence in its future. Its cash position remains one of the strongest in the sector.
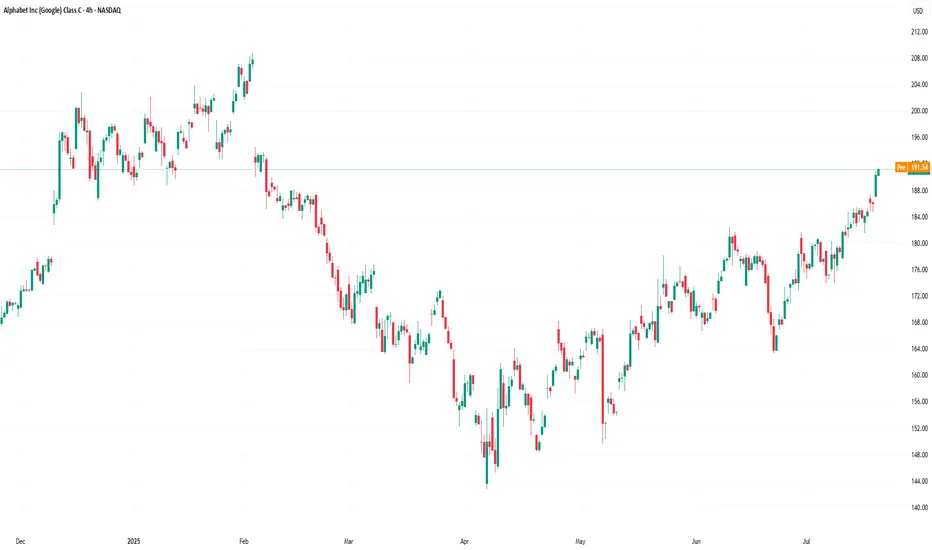
Technical Analysis (Updated)
Yesterday’s closing price was $191.37, within the consolidation zone from early 2025 that took the stock to its all-time high of $208.21. The upward channel seems to be testing a strong resistance zone, and the RSI is showing overbought conditions at 72.66%. The golden cross identified on June 30 remains intact. The strong trading zone around the point of control at $166.67 appears to act as support for the recent rally, indicating a positive bias. Key supports lie around the 200-day moving average ($172.9) and the 50-day moving average ($168). A convincing close above $194–195 may lead to further gains, while losing the $172.9–168 zone could suggest a correction due to high speculation or partial institutional sell-offs.
Conclusion: Train Wreck or Calculated Strategy?
The dominance of artificial intelligence is no longer just a game between American giants. China has entered the arena with a radical strategy: offering free, functional models to the world. The emergence of these state-backed models will force Silicon Valley to respond through moves like this one. Alphabet finds itself at a crossroads. Its financial strength and cloud business give it tactical advantages — even while renting infrastructure to its rivals — although this may dilute its presence as a developer. Still, its big AI bet appears to be advancing more slowly than many hoped. Alphabet’s strategy of participating in its rival’s business could be seen as weakness… or as a long-term masterstroke. Everything will depend on whether Gemini can reach the level of sophistication, adoption, and monetization that its ambition promises. Until then, the global AI landscape has become more complex, more competitive… and more Eastern.
*******************************************************************************************
The information provided does not constitute investment research. The material has not been prepared in accordance with the legal requirements designed to promote the independence of investment research and such should be considered a marketing communication.
All information has been prepared by ActivTrades ("AT"). The information does not contain a record of AT's prices, or an offer of or solicitation for a transaction in any financial instrument. No representation or warranty is given as to the accuracy or completeness of this information.
Any material provided does not have regard to the specific investment objective and financial situation of any person who may receive it. Past performance and forecasting are not a synonym of a reliable indicator of future performance. AT provides an execution-only service. Consequently, any person acting on the information provided does so at their own risk. Political risk is unpredictable. Central bank actions can vary. Platform tools do not guarantee success.