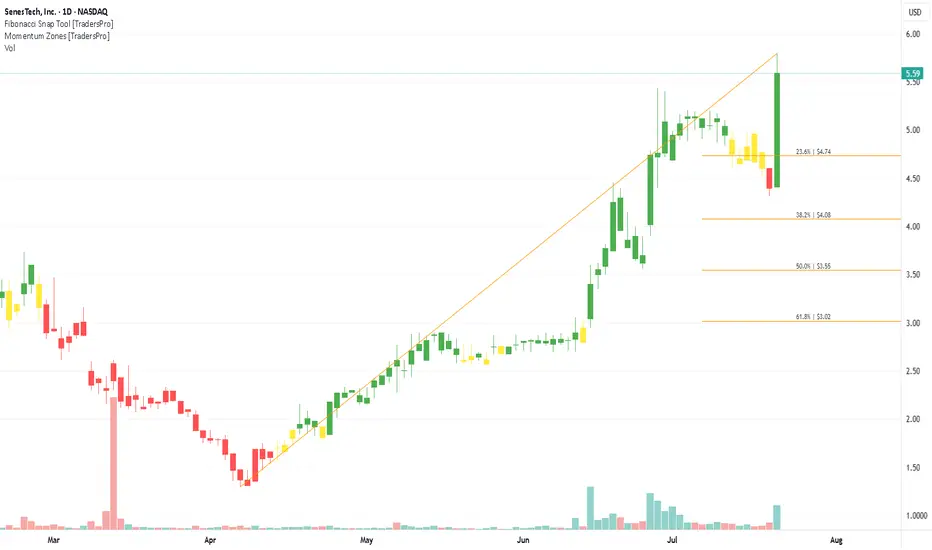
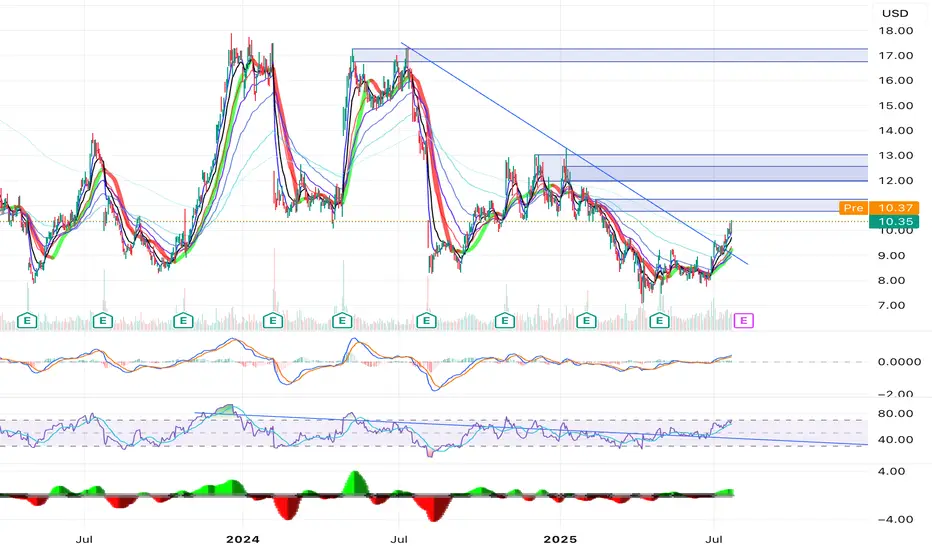
SenesTech, Inc. (SNES) Powers Humane Rodent ControlSenesTech, Inc. (SNES) is a biotech company focused on managing rodent populations through non-lethal fertility control. Its flagship product, ContraPest®, helps reduce rat infestations by targeting reproduction instead of relying on poisons or traps. SenesTech’s growth is driven by rising demand for sustainable pest control, increasing urban rodent issues, and expanding adoption by municipalities, agriculture, and commercial property managers.
On the chart, a confirmation bar with rising volume signals growing interest. The price has moved into the momentum zone by breaking above the .236 Fibonacci level. Traders can use the Fibonacci snap tool to set a trailing stop just below that level to protect gains while staying positioned for potential upside.
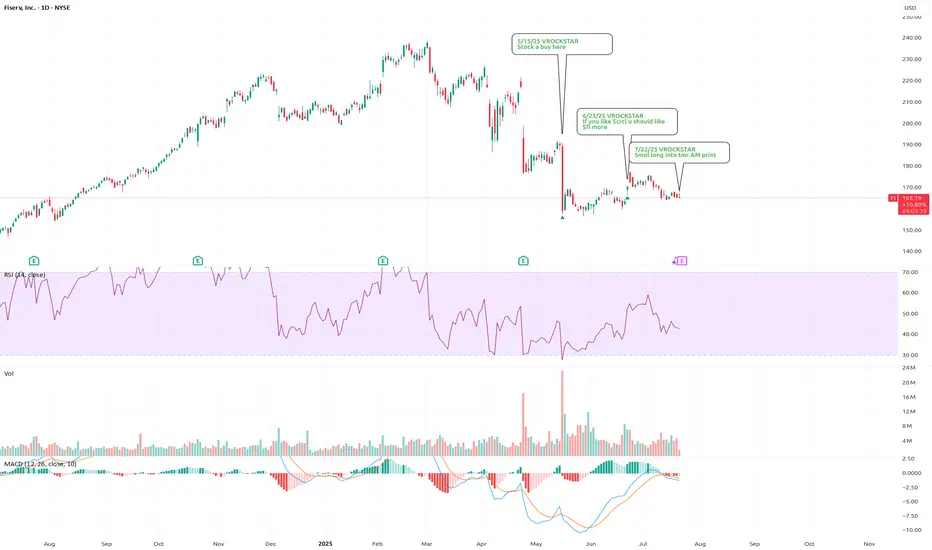
7/22/25 - $fi - Smol long into tmr AM print7/22/25 :: VROCKSTAR :: NYSE:FI
Smol long into tmr AM print
- sub 20x PE and 2x peg (pf adj. for debt) is reasonable for mkt leader
- like the stable coin angle, think they really talk this up... as i've written about previously
- v "consumer" exposed (similar to how i wrote about NYSE:DECK ). if this name sells off hard, i'd be happy to 2...3x the size of position, lower and ITM with a longer-duration strike
- but ultimately at 5% fcf yield, strong mgmt, mkt leader... the setup is probably a 7/10 long and usually i take these pitches but size moderate in order to not lose too much, more of a sharpen the knife position... and remain on my radar to make bigger move if/as. not wed to the stock, think there's other stuff i'd want to own LT instead, but interesting trade for my consideration/ book
whatchu think anon?
V
Correction over? Worth keeping an eye on itIs this the end of the final 5th wave? It’s hard to tell. This stock has been a disaster for those trying to pick bottoms. I’m waiting for a sign of strength before jumping in. We may be seeing that as the RSI is slowly gaining strength.
Personally I’d like to see it change market structure and take out some resistance levels to the upside.
Keeping an eye on this before I pull the trigger.

EXXON MOBIL Critical crossroads.Exxon Mobil (XOM) has been trading within a Channel Down since the June 17 2024 Low and just recently on the July 11 2025 High, it made a Lower High pattern similar to November 22 2024.
As long as the price trades below the 1D MA200 (orange trend-line), we expect to start the new Bearish Leg and test at least Support 1 (97.85).
If however it breaks above the 1D MA200 it will invalidate all prior Lower High patterns, and will most likely follow the (blue) Channel Up to break above the Channel Down. In that case, we will be targeting Resistance 1 (120.00).
-------------------------------------------------------------------------------
** Please LIKE 👍, FOLLOW ✅, SHARE 🙌 and COMMENT ✍ if you enjoy this idea! Also share your ideas and charts in the comments section below! This is best way to keep it relevant, support us, keep the content here free and allow the idea to reach as many people as possible. **
-------------------------------------------------------------------------------
💸💸💸💸💸💸
👇 👇 👇 👇 👇 👇

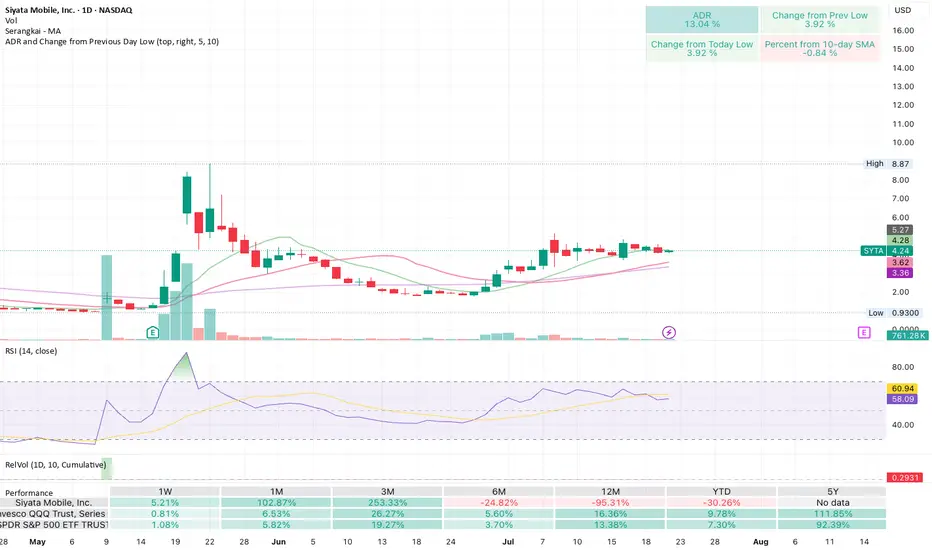
Getting ready to blow! Cup and handle after positive surprisesSiyata makes 2-way telecoms for things like first responders, miltary, construction crews.
Had big earnings and revenue surprises a few weeks ago, and now looks to be forming a cup and handle. Low volume yesterday shows a squeeze pattern like it's getting ready to go.
SNAP out in the open :-) SNAP is out of the 1 year long downtrend trendline.
Alot of bullish signals:
- Trendline breakout
- alot of EMA's crossed
- Squeeze indicator green
Porsche Break-out! Porsche finally broke out of the long resistance trendline with a strong 7% push. Will the stock finally flip its downtrend?
Alot of EMA's crossed, as well as squeese indicators.

LMT: Lookheed Martin Dropped on Earnings 23-07-2025The dividends now is around 3% which is good for a strong company like Lookheed Martin. But as we are seeing a drop in company profits & Equity, and the stock price is near to a support level, we have to monitor the stock for the next few days or weeks. If all is ok, I will consider buying it.
Disclaimer: This content is NOT a financial advise, it is for educational purpose only.

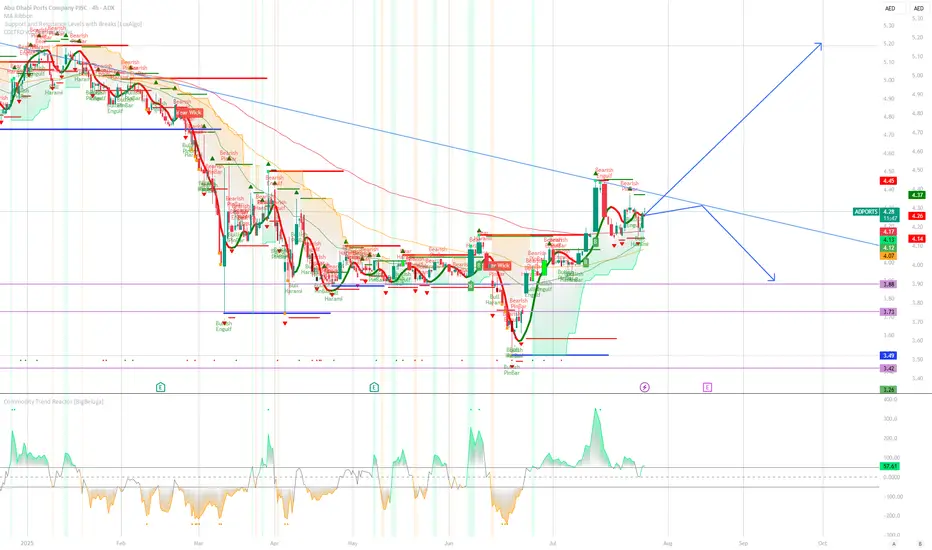
Abu Dhabi Ports at a Technical Crossroads: Breakout or Breakdown📈 Abu Dhabi Ports – Daily Technical Analysis
🗓️ Date: July 23, 2025
📍 ADX: ADPORTS | Price: AED 4.26
➤ Trend Structure:
Abu Dhabi Ports is still trading below a long-term **descending trendline**, keeping the broader bias cautious. Despite a recent bounce from the AED 3.49 lows, price has hit dynamic resistance near AED 4.45 and is showing hesitation.
➤ Candlestick Signals:
* Recent candles show Bearish Engulfing and Harami formations near resistance, indicating potential exhaustion of the bullish move.
* Previous reversal was preceded by a strong Bullish Engulfing near the base support (AED 3.42–3.49).
➤ Scenario Outlook:
🔵 Bullish Scenario (Breakout):
A confirmed breakout above the descending trendline (\~AED 4.45) with strong volume could trigger a trend reversal, opening the path to AED 5.00+ targets. Momentum indicators must turn sharply positive to confirm strength.
🔴 Bearish Scenario (Rejection):
* A rejection from current levels could lead to a pullback toward **AED 4.10**, and possibly retest **support zones** at AED 3.88, 3.73, or the prior swing low at **AED 3.49**.
* Breakdown below AED 4.07 would confirm short-term bearish pressure.
ADX:ADPORTS
📊 Momentum & Indicator Readings:
* **Commodity Trend Reactor** shows weakening bullish momentum, currently around neutral (41.44).
* Price is consolidating inside the Ichimoku cloud; bias remains undecided until breakout.
🧭 Conclusion:
Price is at a **critical inflection zone**.
* Wait for breakout above AED 4.45 (with strong follow-through) for long positions.
* A failure here may confirm a lower-high and favor downside continuation.
📌 Strategy:
"Plan for both outcomes — react to confirmation, not prediction."
COIN Shares Buy at 404 Take Profit at 425NASDAQ:COIN Shares Buy at 404 Take Profit at 425
Stocks SPOT ACCOUNT:
NASDAQ:COIN shares: my buy trade with take profit.
This is my SPOT Accounts for Stocks Portfolio.
Trade shows my Buying and Take Profit Level.
Spot account doesn't need SL because its stocks buying account.
Looks good Trade.
Disclaimer: only idea, not advice

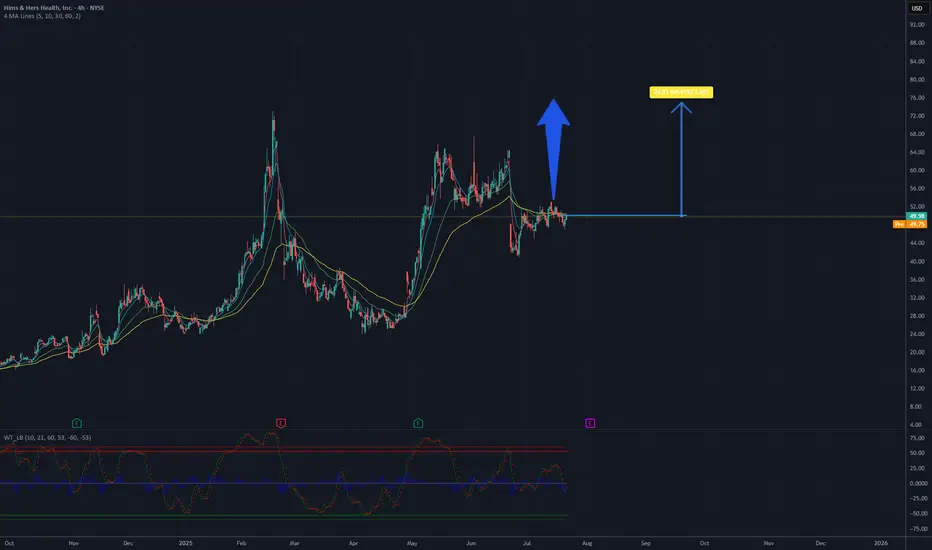
Is it a time for HIMS? Potential 50%,target 75USD.The company has announced plans to introduce comprehensive at-home lab tests, leveraging the acquisition of Trybe Labs, which could enhance service personalization and attract new customers. Additionally, expansion into markets such as Canada and Europe (through the acquisition of Zava) opens new revenue growth opportunities. The company demonstrates continuous financial improvement, including record profitability and a 111% revenue increase since reaching its ATH (All-Time High) in February 2025, which builds investor confidence.
The chart analysis of Hims & Hers Health, Inc. (NYSE: HIMS) indicates a clear upward trend in the recent period. The current price is approximately 49.38 USD. Based on historical data and visible momentum, there is potential for a growth of about 50%, which could bring the price to around 75 USD. Key support is located around 45 USD, while resistance may be tested in the 55-60 USD range before further upward movement. It is recommended to monitor volume and key technical levels to confirm the continuation of the trend.
Potential TP: 75 $
EA – Double Top Short Setup | Watch for Inverse H&S Breakout📘 Description:
Price is currently sitting between two potential outcomes:
A Double Top forming below the 156.91 resistance zone, which could trigger a bearish move toward 121.39 if confirmed by a breakdown through 143.00.
A possible Inverse Head & Shoulders pattern building at the same level, suggesting bullish continuation if price can break and hold above 156.91, with a target near 161.29.
This zone is where the market will likely reveal its hand. Sharing both perspectives to help others recognize the setups and manage risk accordingly.
📉 Short Trade Setup (Double Top):
Entry: Below confirm
Stop Loss: 🔴 156.91
Target: 🟢 121.39
📈 Counter Trade (HSB Long Idea):
Pattern: Inverse Head & Shoulders
Entry: On breakout
Stop Loss: 🔴 143.00
Target: 🟢 161.29
Watch for volume confirmation!
Summary:
Double Top and HSB setups are fighting it out. This zone (153–157) is where the market makes its choice. React, don’t predict. 📊

Gvt&dGVTL&d ⚡ | Powering Up with Strong Structure
Stock moving with rising volume and steady momentum.
Technical setup looks favorable for positional hold!

Kpr millsKPR Mill 🧵 | Solid Base with upmove Potential!!
Volume and structure suggest accumulation — keeping it on radar for a potential breakout.

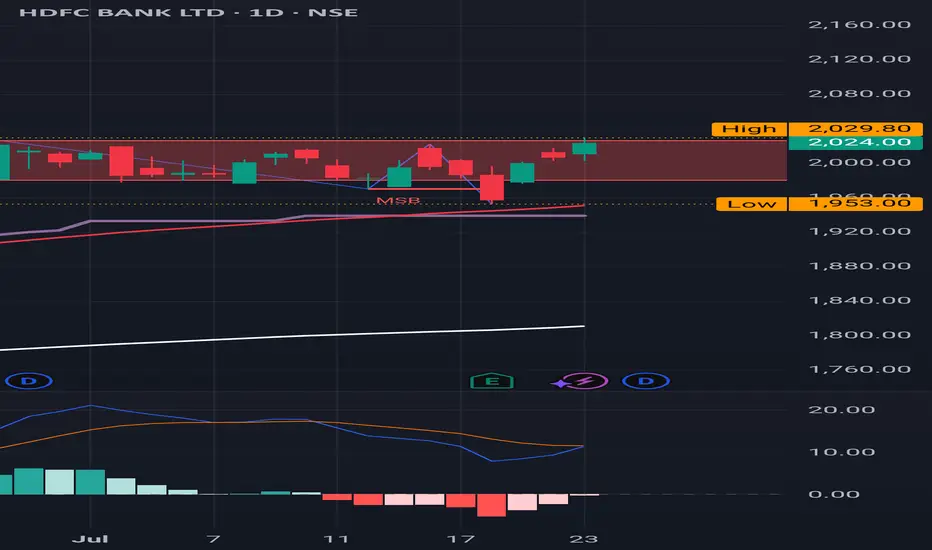
HDFC Bank : Sitting at a major Red Band Resistance
HDFC Bank : Sitting at a major Red Band Resistance
Daily Time Frame.
( Not a Buy / Sell Recommendation
Do your own due diligence ,Market is subject to risks, This is my own view and for learning only .)
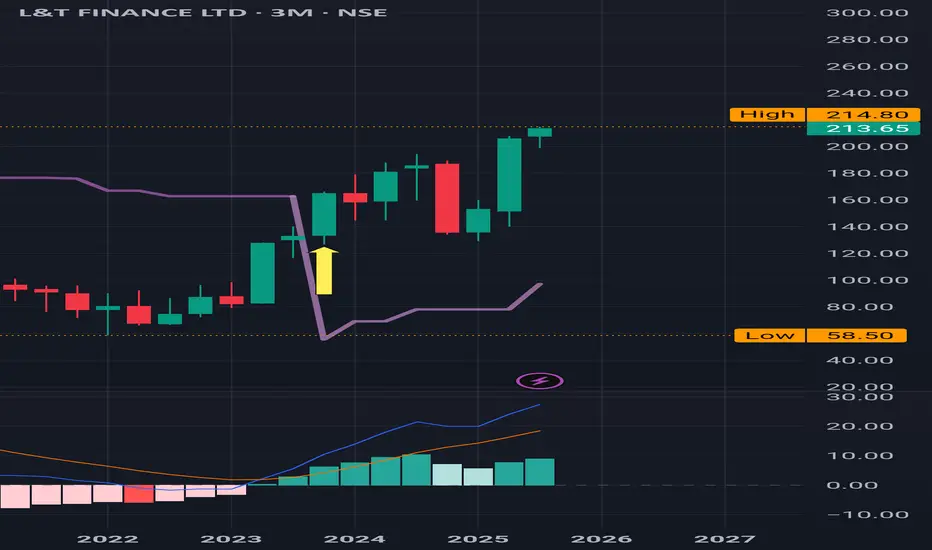
L&T Finance : Made a new High after a buy signal ,3 Months Time L&T Finance : Made a new High after a buy signal . Cleared the previous resistance of 198.90.
3 months Time Frame .
( Not a Buy / Sell Recommendation
Do your own due diligence ,Market is subject to risks, This is my own view and for learning only .)