Elliott Wave Outlook: AMD Expects Pullback Soon Before RallyThe Advanced Micro Devices Inc., (AMD) favors rally in impulse Elliott Wave sequence from 4.09.2025 low & expect upside in to 168.36 – 190.36 to finish it. Impulse sequence unfolds in 5, 9, 13, 17…., swings & ends with momentum divergence. In daily, it ended pullback in 3 swings at 75.22 low in blue box area from March-2024 high. It is trading higher in nest & expect 13 swings to finish the impulse ((1)) before correcting next. Currently, it favors rally in 7th swing in daily & expect end soon in to 165.63 – 179.16 area before correcting in (4) as 8th swing. In 4-hour, it ended (1) of ((1)) at 97.91 high, (2) at 83.75 low in 4.21.2025 & favors rally in (3) as extended wave. Within (3), it placed 1 at 122.52 high, 2 at 107.09 low, 3 at 162.36 high, 4 at 149.34 low of 7.22.2025 & favors rally in 5. It is showing higher high since April-2025 low.
Below 3 high of 162.36, it ended 4 pullback in double three correction at 149.34 low. It ended ((w)) at 155.81 low, ((x)) at 160.34 high & ((y)) at 149.34 low. Above 4 low, it favors rally in ((i)) of 5 in to 165.44 – 170.43 before correcting next. Within ((i)), it ended (i) at 155.53 high, (ii) at 152.66 low, (iii) at 161.20 high, (iv) at 158.36 low & favor higher in (v). It appears three swings in (v) & expect pullback before final push above 161.52 low before correcting in ((ii)). Alternatively, the current cycle from 4 low can be 5 of (3) before it corrects in (4). In either the case, the next pullback should remain supported. In 4-hour, it is trading in 11th swing & expect pullback in 12th swings later before final rally. We like to buy the pullback in 3, 7 or 11 swings at extreme area for the upside in ((1)).

Xiaomi probably “bottomed” as China most major stocks. 8/Nov/22Xiaomi’s share price probably found its long term base with double bottom pattern at support zone.

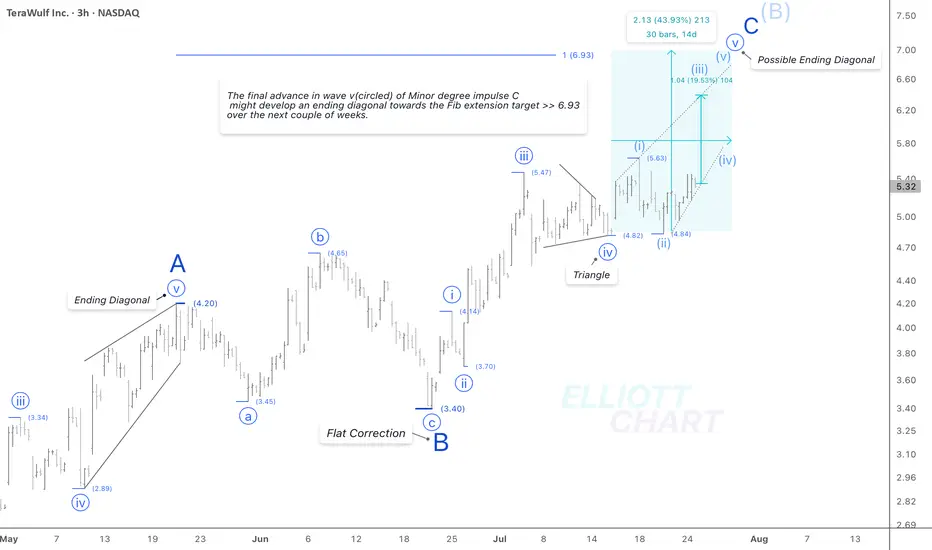
WULF / 3hWave Analysis >> While the current outlook on WULF remains consistent with previous analysis, the internal structure of wave v (circled) suggests the potential development of an ending diagonal in the final leg of Minor degree wave C.
Trend Analysis >> Upon completion of Minor degree wave C, the countertrend advance of Intermediate degree wave (B), which has been unfolding since April 9, is likely to give way to a decline in wave (C) of the same degree. This downtrend might begin in the coming days and potentially extend through the end of the year.
NASDAQ:WULF CRYPTOCAP:BTC BITSTAMP:BTCUSD MARKETSCOM:BITCOIN
#CryptoStocks #WULF #BTCMining #Bitcoin #BTC
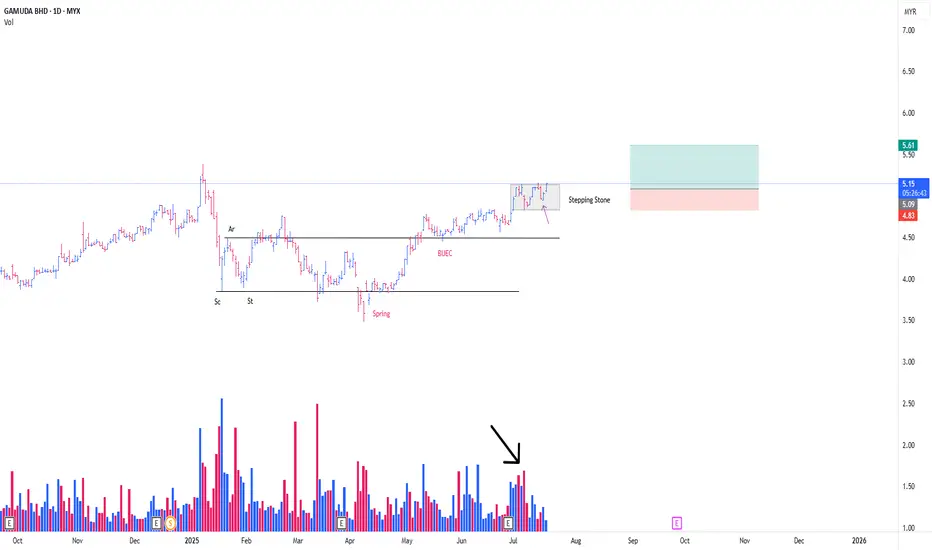
GAMUDA CONT MARKING UP PHASEThis is a continuation from my prev post
**Refer to the link below
This is a play coming from the Stepping Stone (SS)
-SS is a term, in wcykoff methode , particularly describing a momentarily 'pause' in between, consecutive mark up phase.
Absoprtion detected from the on going SS
*Black arrow
with the possibility of Trigger Bar today, in the background of SpringBoard Schematic #2 *Purple arrow
-Position initiated as attached
PureWyckoff
NVDA: Last week of July Just my thoughts on NVDA.
Not advice of course.
As always, trade safe and have a great weekend!

Jindal SteelAnother strong candidate from the metal sector. Huge consolidation and VCP in ratio charts show that it can be good candidate provided metal sector start working

Tata SteelGood stock from the strong sector seems Tata Steel. It is under consolidation since long and not outperformed the NIFTY since long. Keep track.

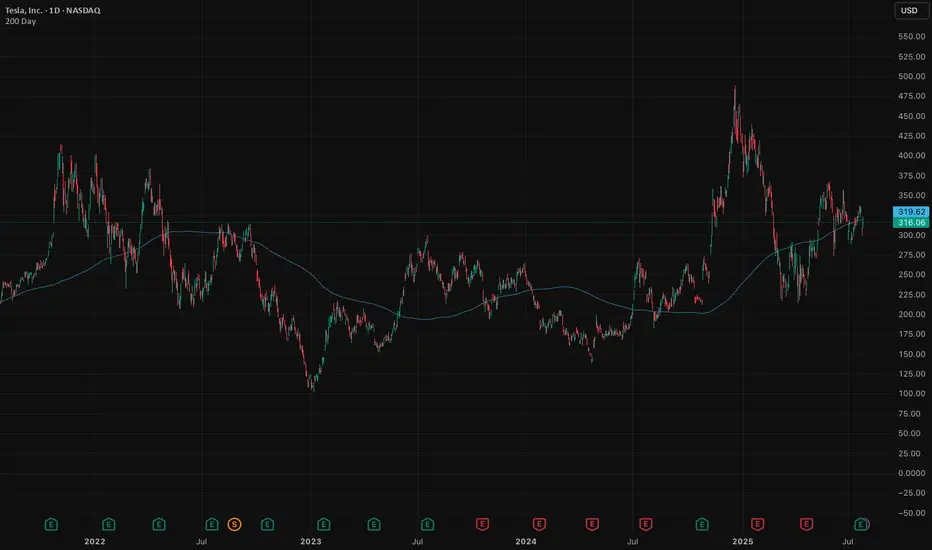
Tesla in the waiting room as revenue slidesTesla is a global innovator that is changing the world. As a general rule, many investors have a saying: Never bet against Elon. They're not wrong. Elon delivers. But the short term is messy.
The stock is hovering around its 200-day moving average, a critical test. Break lower and we could see $290, maybe $260. That’s not panic, it's just price catching up to reality.
The auto business is deep in a downcycle. Q2 deliveries fell 14%, with revenue down 12%. Profits squeezed. Classic cyclical move. Nothing new here. But it’s weighing on momentum.
The upside isn’t about cars, it's autonomy, robotaxis, AI (Grok in cars). That’s where Tesla becomes a $2 trillion company. Musk knows it and is building for the future (100,000 GPU super cluster). He’s already shifting the story.
But that future is 6–12 months out, maybe longer.
In the meantime, we sit in the waiting room. Auto volumes need to stabilise. Robotaxi needs scale. Optimus requires proof and some definitive timeframes to get the market excited. That creates a 3–6 month narrative gap. Markets hate gaps.
Earnings last week were among the softest (though expected). EPS fell 23%. Free cash flow almost vanished. No real catalysts until next quarter. If the broader market sells off, which looks likely, Tesla takes more heat.
But let’s not lose the plot. Tesla is still Tesla. Long-term vision remains. Musk’s execution record is unmatched. Bet against him and you lose, eventually.
Short term, expect weakness. Patience required. If the stock breaks $315 with conviction, we’d expect further weakness before the real upside re-emerges.
Wait, watch, then pounce.
The forecasts provided herein are intended for informational purposes only and should not be construed as guarantees of future performance. This is an example only to enhance a consumer's understanding of the strategy being described above and is not to be taken as Blueberry Markets providing personal advice.
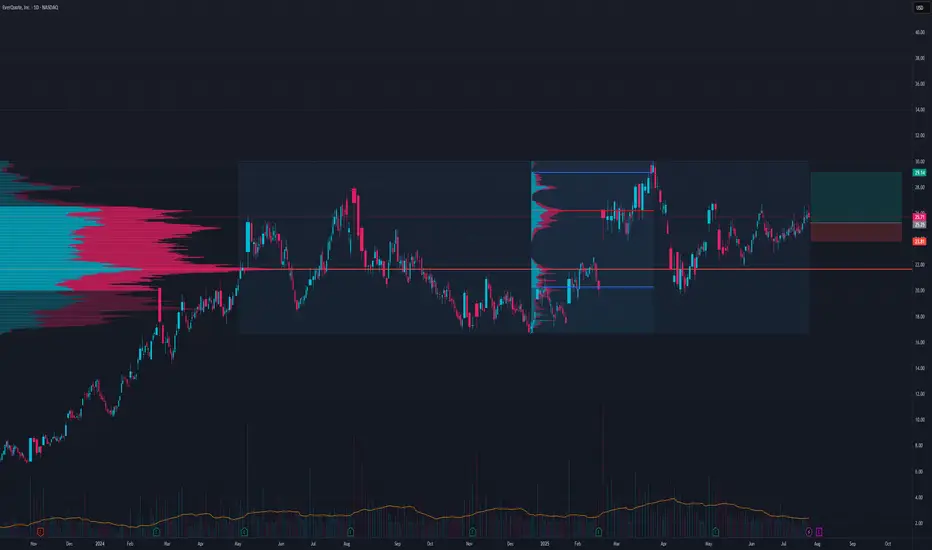
EVER LongIf we get a pull back this is a pretty good risk reward, but it will probably break this range and head towards 33$
SL at 23.74
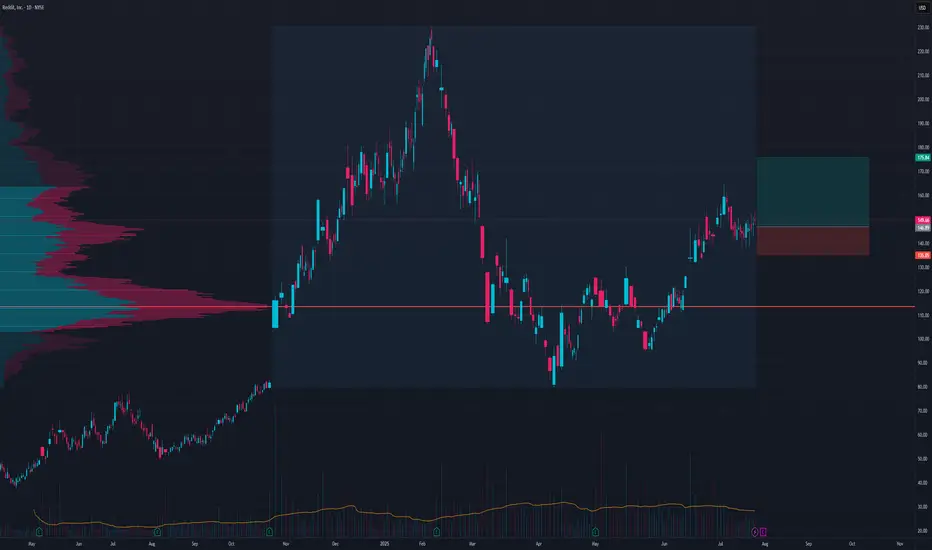
RDDT LongOn a pullback to 146 there is a 2.45 risk to reward setup
I like the volume accumulation here it seems prime to push out of this volume profile
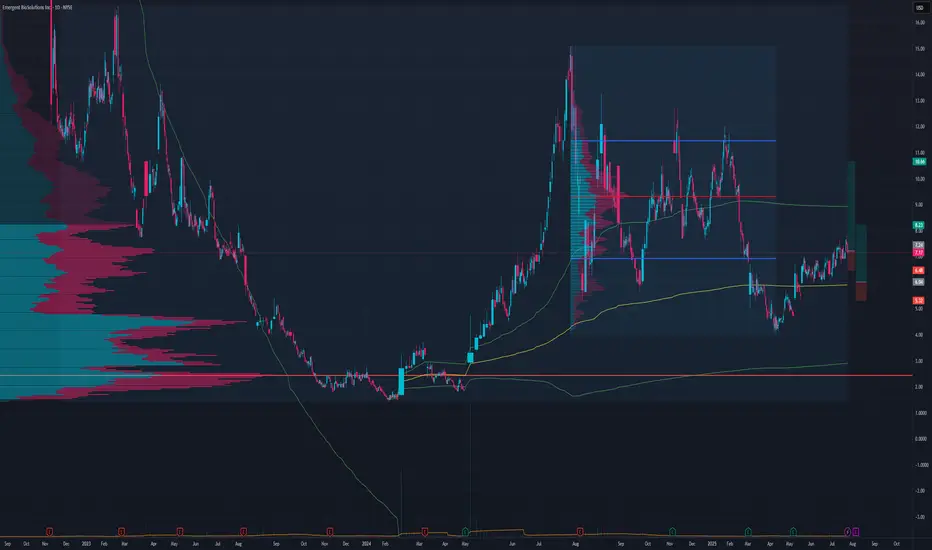
Another HL winner?I like this patter and potential push away from POC
Even tho tp could be higher and setup is still valid until 5.4 for a shorter term SL is at 5.7 and TP at 7.33 for a good risk to reward
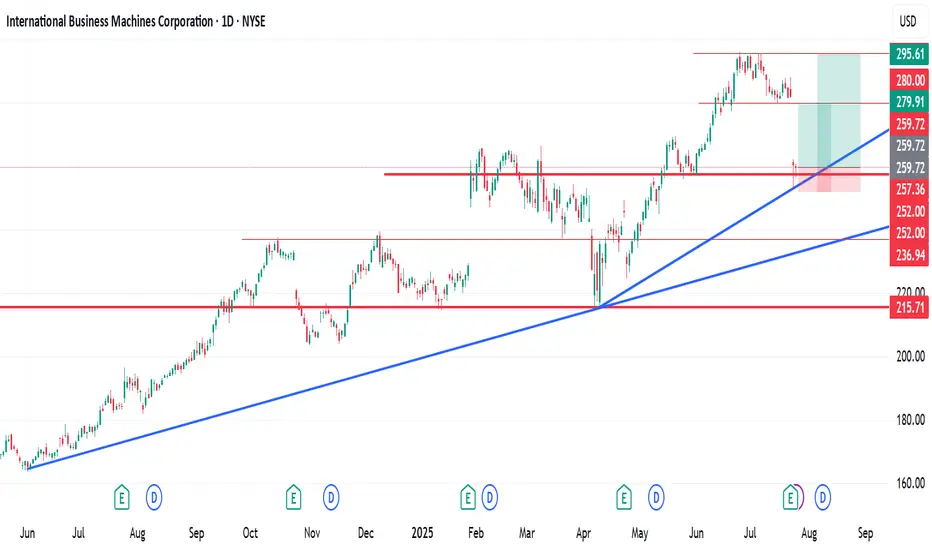
IBM Stock Forecast and Technical OutlookIBM Stock Forecast and Technical Outlook.
International Business Machines Corporation (IBM) reached a recent peak in June 2025 before experiencing a gradual decline. On July 24th, the stock saw a significant drop of over 10%, likely triggered by investor reaction to recent company news or broader market sentiment.
Despite this sharp decline, technical indicators on my chart suggest the potential for a short- to medium-term recovery. Based on my analysis, there are two potential setups with favourable Risk-to-Reward (R:R) ratios:
Scenario 1: R:R of 1:2.63
Scenario 2: R:R of 1:4.65
I bought some shares at $260.17
These figures indicate that for every unit of risk taken, there is a potential return of 2.63x or 4.65x, respectively, depending on the chosen entry and exit strategy.
As always, investors are advised to conduct their due diligence and apply proper risk management techniques before entering any position.
Hey friends, if this is helpful, kindly like, follow, subscribe, share and comment
#QS - 4HR [Will the last boost last or will it bust? With a new Volkswagen investment and partnership. Quantum Scape’s earnings were far from stellar with a 26% decrease in income compared to same time last year. They have, nevertheless, made advancements with their very promising lithium-Metal battery technology.
With fundamentals aside, I am curious to gauge how long-term investors have priced-in the company's stock price.
Technically, I see price moving to present yet another opportunity by EOY if not sooner. My count shows important levels to watch.
Go #QuantumScape, Go!!!
Check out my other chart ideas @CaxhPrince everywhere.

Yum! Brands Inc. (YUM) – Potential Head & Shoulders Breakdown📉 Short Setup
🔍 Description:
Yum! Brands Inc. (NYSE: YUM) appears to be forming a Head & Shoulders pattern — a potential bearish reversal signal. The neckline support is holding for now, but a confirmed breakdown below this level would suggest downside momentum.
📊 Trade Details:
🔹 Entry: Below neckline confirmation (close under support)
🔴 Stop Loss: 153.05
🟢 Target: 138.30
📌 Confirmation:
Watch for a decisive close below the neckline to confirm breakdown. If the neckline holds, this setup could fail, and price may remain range-bound or reverse back up.
Trade safe! 📉✅

AT&T – Still Ringing?AT&T. The name alone evokes landlines, long-distance charges, and a time when phones had cords (and possibly rotary dials). But don’t let the vintage vibes fool you — this telecom titan might still have some signal left on the price chart.
Now, I’m not saying AT&T is about to moonwalk up the NASDAQ leaderboard — but I’ve seen slower giants pick up speed. And if you squint just right, the chart has been whispering, "Maybe I’m not dead yet."
From a chart perspective:
After what felt like years of sideways static, the price may finally be picking up a bar or two. Recent structure hints at a potential trend reversal — or at least a modest attempt to climb out of the basement. Support levels are holding like a stubborn dial-up connection, and the candles are starting to lean north.
Is this the beginning of a full-blown comeback or just a dead-cat bounce in a trench coat? Hard to say. But I’m watching with interest — and maybe a little nostalgic hope that this once-glorious phone company still has some long-distance strength left in it.
No guarantees, no predictions — just one person watching a chart and thinking: "This thing might still be ringing."
A lighthearted market musing, not financial advice!

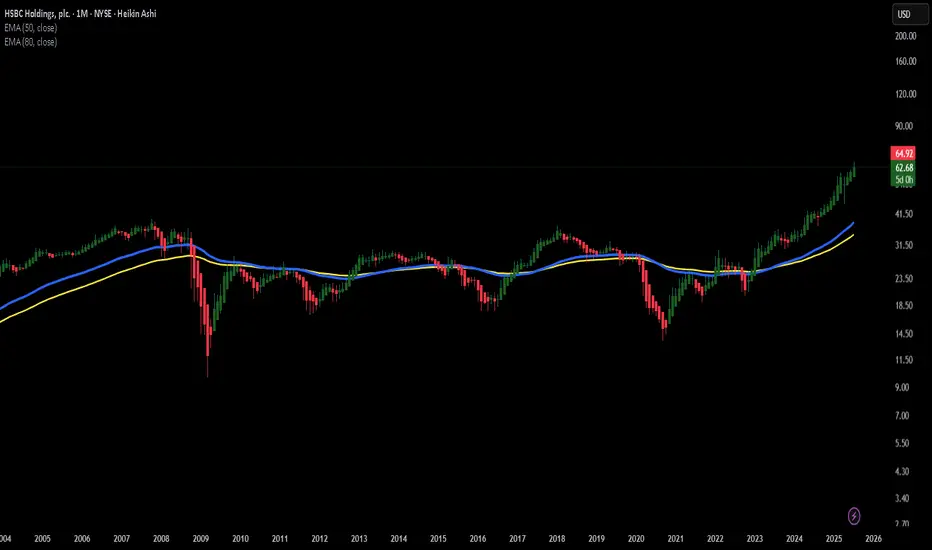
HSBC – Big Bank EnergyHSBC. The name alone sounds like it should be engraved in stone above a massive marble doorway somewhere in London, guarded by two lions in tuxedos. It’s one of those banks that’s been around forever – the kind of institution that probably has an emergency plan for a meteor strike… and a tea protocol for after.
And yet, when I look at the chart, I don’t just see a slow-moving financial giant. I see a potentially elegant bulldozer gently carving its way upward. Recent price action has been forming what looks like a series of higher lows, and we might just be watching a classic "big-bank-breakout" in slow motion.
From a chart perspective:
Price has been flirting with key resistance, perhaps like a banker flirts with risk – cautiously, from a safe distance, and only with proper documentation. But if momentum keeps building, it might finally stop sipping tea and actually make a move. Possibly upward. Possibly politely.
There’s no guarantee, of course. This isn’t a prediction – more like the market equivalent of a raised eyebrow and a curious “hmm.” I’ll be keeping an eye on HSBC to see if this old titan is ready to shake off the pinstripes and surprise us all.
A lighthearted market musing, not financial advice!
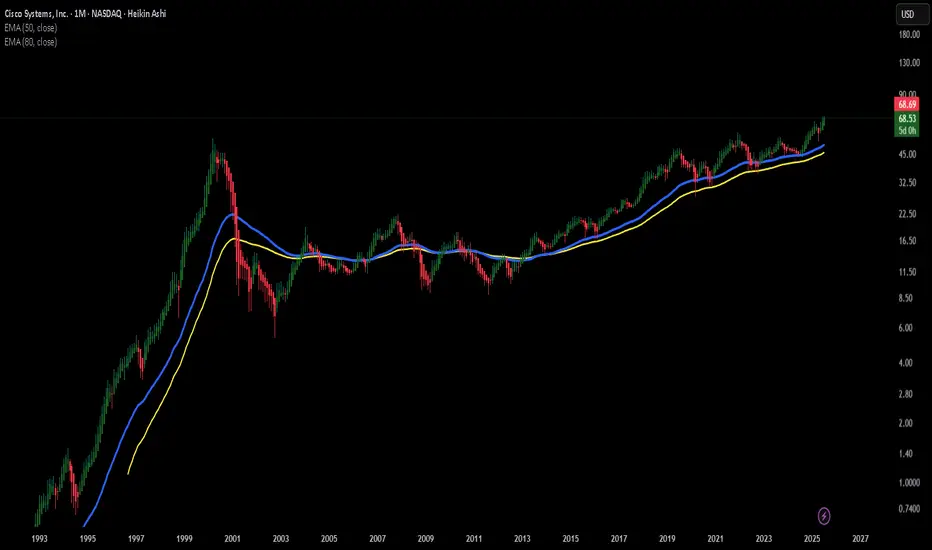
CSCO – Cisco’s Not Done Dancing Yet!
When I look at CSCO, I get the feeling that this old-school tech legend still has some rhythm left in its step. It’s like that uncle at the family wedding who’s been around the block but somehow still manages to pull off a surprisingly smooth move on the dance floor.
It may not be the flashiest stock on the NASDAQ, but there’s something about the way it moves – slow, steady, confident – that makes me think it might just be preparing for another swing to the upside.
From a chart perspective:
Recently, CSCO has been respecting a rising trendline and forming a sequence of higher lows – a classic sign of underlying strength. The price is now approaching a zone that has previously acted as resistance. If momentum builds, this level could turn into a launchpad. Of course, the market doesn’t always follow the script, but the setup looks promising from where I stand.
No predictions, no guarantees – just one trader’s interpretation of the chart. If Cisco keeps moving like this, I’ll be following the rhythm with curiosity (and maybe a fresh cup of coffee).
A lighthearted market musing, not financial advice!
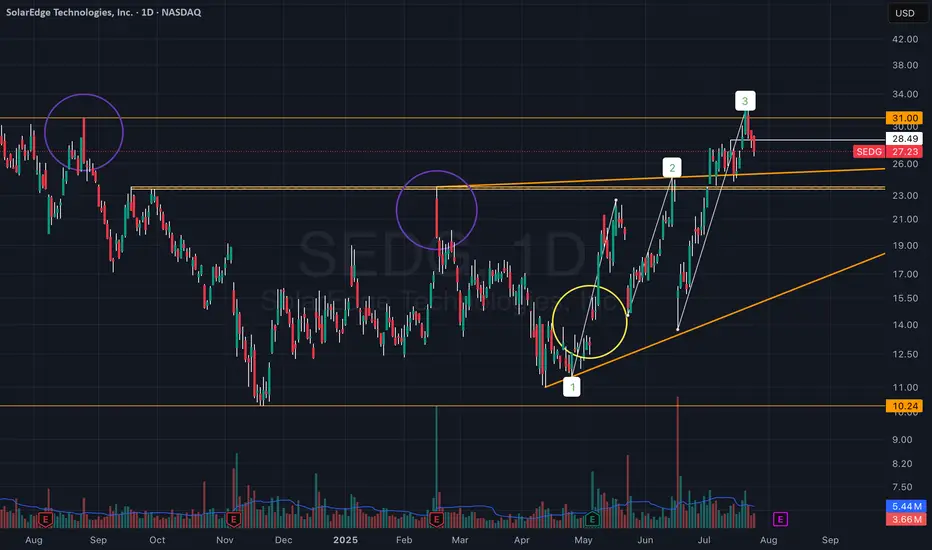
Are We Witnessing a Trend Reversal in SEDG?Something I’ve been watching closely these past few days — SEDG (SolarEdge):
There’s a setup unfolding that I think could benefit from a few more eyes on it:
• The two purple circles mark large vector candles that initiated sharp downward moves.
• The yellow circle highlights the quarterly earnings release, which triggered a strong upward move toward the $20–24 zone — the area of the first vector candle.
These vector candles reflect strong institutional activity that clearly impacted price movement.
A breakout above these zones could signal a meaningful trend reversal forming in the stock.
Price was rejected twice from this area with strong dips, but on the third attempt, it broke through, reaching the next vector candle zone around $26–31.
Now, price is approaching this upper zone with strong momentum following the breakout.
After reviewing the recent earnings report, I noticed a clear recovery and a significant upward revision in guidance, suggesting the company may be shifting direction.
Whether this holds is uncertain — but price action suggests the market is pricing in real change.
We recently printed a high of $32.45, above the $31 vector zone — a notable sign of strength.
At the moment, we appear to be pulling back into support, and structure remains intact.
Yes, there’s clearly a strong battle happening now — but I’m convinced the momentum is with the bulls.
It feels like someone already knows what’s coming in the next earnings release, or at least senses a shift in the company’s trajectory.
Everything seems to be building toward the next earnings report, expected early August.
SoFi's Surge: Unveiling 2023 and What Lies Ahead in 2024Technical Analysis Overview
Current Price : $10.34, a 3.77% increase.
Weekly Trend : Showing a positive trend with a 5.35% increase over the last five days.
1-Month Trend : A significant increase of 51.96%, indicating strong bullish sentiment.
6-Month and Yearly Trends : A 17.04% increase over the last six months and a 124.51% increase year to date, highlighting a robust bullish trend.
Advanced Technical Indicators
Relative Strength Index (RSI) : 70.41 - Indicating that SOFI is nearing overbought territory, which could lead to a potential reversal or consolidation in the short term.
Moving Average Convergence Divergence (MACD) : 0.63 - Suggesting bullish momentum, indicating a strong buying trend.
Other Indicators : STOCH (83.28), STOCHRSI (84.02), ADX (37.09), Williams %R (-8.57), CCI (104.63), ATR (0.46), Ultimate Oscillator (54.76), and ROC (24.66) all contribute to a picture of current bullish momentum but with potential for short-term volatility or pullback.
Market Sentiment and External Factors
Market Capitalization : $9.904B USD.
Trading Volume Analysis : A high trading volume of 35,199,288, suggesting active market participation and interest in the stock.
Recent News Coverage Impacting SOFI
Bullish Outlook for 2024 : Analysts predict SOFI stock could continue its rally in the new year, benefiting from expected interest-rate cuts. A notable analyst has set a high price target of $14 for SOFI stock, implying significant upside potential ( InvestorPlace ).
Focus on Non-Lending Businesses : Analysts appreciate SoFi's shift towards non-lending businesses, improving earnings quality despite a higher-for-longer interest-rate policy.
Central Bank Policy Changes : Potential interest rate cuts in 2024 could benefit SoFi's lending business, as lower rates tend to spur borrowing and lending activity.
Conclusion
SOFI's stock shows strong bullish signs in the medium to long term, but the current overbought condition warrants caution for short-term traders.
The recent news and analyst predictions provide a positive outlook for 2024, making SOFI an interesting stock for both traders and long-term investors.

Apple Inc. (NASDAQ: AAPL) – Potential Breakout from Bullish ABCDApple has recently formed a well-structured ABCDE corrective pattern inside a broader sideways range, suggesting accumulation and possible trend continuation on breakout.
Technical Breakdown:
🔸 ABCDE Formation: The structure resembles a contracting triangle or bullish consolidation, marked by higher lows (A, C, E) and lower highs (B, D), signaling price compression.
🔼 Breakout Zone: Price has moved above point (D) briefly and is now consolidating around the $214 zone. A strong close above this could lead to continuation toward the $237 and $260 resistance levels.
🔻 Support Levels:
Minor support at $207.45
Strong base support near $193.44 (ABC low)
📈 Volume Spike: The most recent leg from E to D showed a significant volume surge, indicating possible institutional interest or breakout anticipation.
🔍 Trade Outlook:
A sustained move above $217–$218 with volume could trigger a bullish breakout.
Targets:
First: $237.33 (recent horizontal resistance)
Next: $260.15 (gap-fill or prior high zone)
Risk Management: A drop below $207 would invalidate the structure and suggest further range-bound behavior or downside.
⚠️ Disclaimer: This chart is for educational purposes only. We are sharing a trade setup based on technical signals generated by our private invite-only indicator. This is not financial advice or a recommendation to buy or sell any financial instrument.
📊 The indicator highlights potential buy/sell zones based on a custom strategy developed by our team. In this chart, we are demonstrating how the signal aligned with market structure and trend conditions.
🛑 Regulatory Note: We are an independent development team. Our private indicator and services are not registered or licensed by any regulatory body in India, the U.S., the U.K., or any global financial authority. Please consult a licensed advisor before making trading decisions.

SBI LIFE INSURANCE CO LTD Breakout Watch Above ConsolidationSBI Life has been consolidating in a sideways range between approximately ₹1,770 and ₹1,860 for over 40 days. The price recently tested the upper boundary of this range and closed near the resistance with strong bullish momentum and above-average volume, signaling potential accumulation and a likely breakout attempt.
Technical Highlights:
Range-bound structure: The stock traded in a narrow horizontal channel for over a month, indicating a base formation.
Bullish breakout attempt: Today’s strong green candle with a +2.15% gain is testing the upper resistance zone.
Volume confirmation: The breakout move was supported by a significant volume spike, suggesting increased institutional activity.
Volatility contraction: The tight price action before this move signals a potential volatility expansion, typically preceding a trend.
Potential Price Path:
If the price sustains above ₹1,860 with follow-through buying, the next key resistance levels are projected around ₹2,020–₹2,200.
⚠️ Disclaimer: This chart is for educational purposes only. We are sharing a trade setup based on technical signals generated by our private invite-only indicator. This is not financial advice or a recommendation to buy or sell any financial instrument.
📊 The indicator highlights potential buy/sell zones based on a custom strategy developed by our team. In this chart, we are demonstrating how the signal aligned with market structure and trend conditions.
🛑 Regulatory Note: We are an independent development team. Our private indicator and services are not registered or licensed by any regulatory body in India, the U.S., the U.K., or any global financial authority. Please consult a licensed advisor before making trading decisions.
