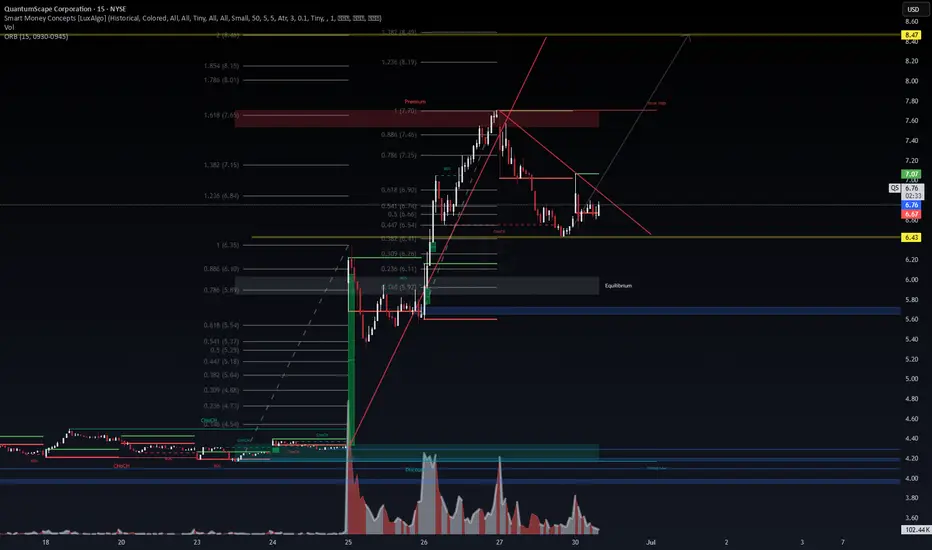
QuantumScape ($QS) – VolanX SMC Activation Zone🔍 Technical Context
QuantumScape is setting up for a potential bullish breakout after consolidating within a descending wedge and maintaining structure above the golden Fibonacci pocket (0.5–0.618 zone). Smart Money Concepts (CHoCH + BOS) have been triggered, indicating the start of institutional positioning. Volume has compressed, often a prelude to explosive movement.
📊 VolanX Probability Matrix
🎯 Probability of Bullish Continuation (Target $8.47): 70–75%
📉 Probability of Failure (Drop to $6.43 or lower): 25–30%
🧠 Key Levels & Confluences:
Entry Zone: Break & close above red trendline ($6.85+)
Premium Target: $7.65–7.70 (Liquidity Zone)
Final Target: $8.47 (Fib 2.0 Extension)
Stop-Loss Invalidation: Below $6.43 (structural break)
SMC Zones: Liquidity void + breaker retest + CHoCH confirmation
📈 Risk-Reward Setup:
RRR ≈ 3.8x, with structural confluence across Fib, volume, and SMC
💡 “We don’t just trade the chart — we activate the timeline.” – VolanX Protocol
🔐 This post is part of WaverVanir International LLC’s multi-asset DSS framework.
#SMC #QuantumScape #VolanX #WaverVanir #Fibonacci #SmartMoneyConcepts #OptionsFlow #LiquidityZones #Breakout #TradingStrategy #RiskReward #TechnicalAnalysis
EAND – Gaining Momentum for the Next MoveEtisalat Group appears to have bottomed, establishing a key accumulation range between 15.74–18.58 AED. Price is currently playing within this range, building a solid base after a prolonged downtrend.
If Etisalat breaks above the 18.58 AED resistance with strong volume and follow-through, it opens the door to a clean upside move toward the next key levels:
T1: 20.14 AED
T2: 22.24 AED
T3: 25.88 AED
T4: 28.70 AED
The structure is tight and range-bound, but the market sentiment shows early signs of strength. A breakout from this base would confirm a shift in trend and could trigger a mid- to long-term bullish leg.
📌 Risk management: The 15.74 AED level serves as the invalidation zone. As long as price holds above it, bulls remain in control of the setup.

6/30/25 - $cvna - Sizing up... again? tf lol6/30/25 :: VROCKSTAR :: NYSE:CVNA
Sizing up... again? tf lol
- "tf" is the theme of rn
- do stonks rumble higher w/ some garden variety pullbacks? yes, i think so
- but guys... there are some real terminal losers out there trading like they just discovered the cure for death
- if you like this one, perhaps you should consider tsla
- when i get this one (cvna) pitched... it's like when new-to-be-rekt-crypto-bros tell me "XRP is going to beat BTC". no it won't. and that's an incomplete thesis.
- cvna sells cars to poor people with bad credit and then off balance sheets this risk to other "parties" (some of which are related parties) and that train will run off the tracks, eventually. tomorrow? probably not.
- but as we round the corner into 2H, funds that own this (Like we saw w/ pltr on friday) will say "do i need as much cvna".
- ofc there will always be those who think they've got a winner
- but the market is smart.
- so just keep your head screwed on
- because this one is setting up nicely, again, on the short side
V

KIMS READY TO BREAK OUTKIMS moving in a range and now looks ready to breakout from here once moved out of this box

MSTR breakout time? NASDAQ:MSTR attempting to breakout of the channel on the 4th test, the high probability magic number!
Channel pattern target is 9% move to $426. The High Volume Node EQ at $438 is a more likely area of resistance if we get this love.
Safe trading

Oscar (OSCR) – Tech-Enabled Healthcare with Margin Momentum Company Snapshot:
Oscar NYSE:OSCR Health is a technology-focused health insurer leveraging data and digital platforms to deliver affordable, personalized care. Its platform-centric model improves member experience, cost control, and care outcomes—setting it apart in a highly regulated sector.
Key Catalysts:
Steady Execution Under Proven Leadership 🧠
CEO Mark Bertolini (ex-Aetna) brings credibility and strategic clarity, reinforcing investor trust in Oscar’s long-term viability.
Focus remains on operational discipline, risk management, and scalable infrastructure.
2025 Guidance Reaffirmed 📊
Following a solid quarter, Oscar reaffirmed full-year 2025 guidance, projecting margin expansion and sustained growth despite sector headwinds.
Medical loss ratio (MLR) held steady at 75.4%, absorbing a $31M prior-period hit—showing resilience in cost containment.
Robust Financial Flexibility 💰
With $1B+ in free cash flow, Oscar is well-positioned for:
Organic growth in new markets
Potential share buybacks or dividends
Continued investment in digital infrastructure
Investment Outlook:
Bullish Entry Zone: Above $17.00–$17.50
Upside Target: $32.00–$33.00, supported by margin stability, capital strength, and smart execution.
🩺 Oscar is transforming health insurance from reactive to predictive—backed by tech, discipline, and capital strength.
#OscarHealth #OSCR #HealthTech #InsurTech #DigitalHealth #MarkBertolini #MedicalLossRatio #FreeCashFlow #TechEnabledCare #HealthcareStocks #Bullish #ValueDelivery #HealthInnovation

CAVA - Double bottom + Descending triangle NYSE:CAVA has formed a potential double bottom within a larger descending triangle. On top of that, the stock has also broken out of the internal falling wedge formation with a strong bullish break.
Ichimoku shows potentially a two out of three bullish crossover.
Both stochastic oscillator and 23-period ROC shows bullish divergence AND oversold signal.
Volume wise, last Friday's high volume bar and weak doji candle signals divergence, hence today;s strong bullish opening was confirmed and it ought to rally higher to 125.00 over the mid to longer term period.

Tesla-Heading For A New ATH?NASDAQ:TSLA is looking good!
Robo-Taxi, Optimus Robots...and so more to come!
Tesla to $692 in the next years? Or months?
#stocks #tesla #stockmarket

Apple Consolidates Above $200 with Upside PotentialAAPL is trading sideways, consolidating above $200.0.
Resistance stands at $203.0, and if breached, Apple could rally toward $206.0.

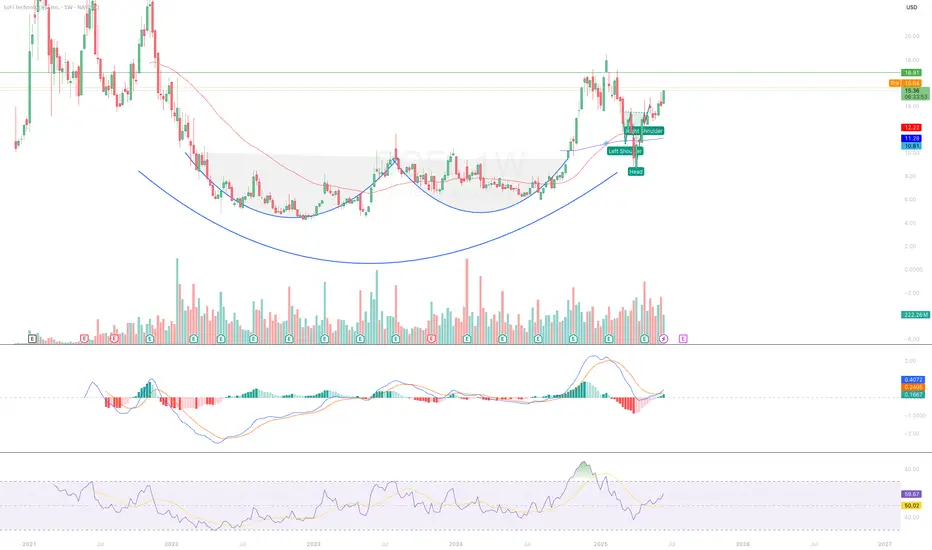
SOFI Classic BUMBUM Breakout !I think I am beginning to like this classic bumbum formation.
NASDAQ:SOFI broke from the classic bumbum formation and retraced back to its support levels at $8.
It has recently started making a bullish reversal move back to $15, in the turn forming an inverse head and shoulder formation.
If the current momentum is sustained and the $16 resistance is cleared; I expect a move towards $23.34.
💼 Position
Type: SOFI 15 Call
Expiry: July 11, 2025
Quantity: 10
Average Cost Basis: $0.58
Date Purchased: June 10, 2025
Last Price: $1.01
Total % Gain/Loss: +75%
$NVDA Tradespoon – Long Entry $152.62Tradespoon model generated long signal for NASDAQ:NVDA . Predicted range: $152.62–$158.22. Trend: -0.22%. NASDAQ:NVDA

AAPL Inside a Coil – Big Move Loading from the $200 Zone 🧠 GEX-Based Options Sentiment:
Apple (AAPL) is caught between tight gamma compression and heavy resistance.
The $205–$207 zone is packed with GEX9 and multiple Call Walls. This is the key ceiling that has rejected price repeatedly over the past week. On the other side, the Highest Positive Net GEX / Gamma Wall is just below at $202, acting as the current pivot level.
Support sits around $197.50, marked by the HVL zone and the lower end of GEX structure. Below that, $195 is protected by the 2nd PUT Wall — a critical gamma defense zone.
Implied Volatility Rank is 20.7, so options are still relatively cheap. Notably, we’re seeing a 5% PUT flow dominance, a subtle bearish tilt — not extreme, but worth watching.
🔧 Options Setup for Monday–Wednesday:
Bullish Scenario:
If AAPL clears $203.21 and holds, this opens up the play toward $204.98 (Gamma Ceiling), and potentially $207 if momentum builds.
You can consider a CALL debit spread, like 202.5c/205c or 205c/207c for July 3/5 expiry.
Stop out if price drops below $200.
Bearish Scenario:
If AAPL fails to hold $199.50 and breaks through $197.50 HVL, we may see a sharper unwind toward $195 or even $190 PUT wall zone.
Consider 200p or 197.5p for July 3 expiry.
Cut if price reclaims $202 with strength.
📉 1-Hour Chart Breakdown:
Price has been coiling in a symmetrical triangle just below the $203–$205 resistance supply zone. There’s a visible CHoCH just under structure, with multiple tap rejections from the overhead resistance.
The recent CHoCH printed after a bounce from minor demand, suggesting that sellers are still defending the top channel. Volume has been flat, but tightening price range signals an imminent breakout or breakdown.
As long as price remains pinned inside this triangle under the BOS and supply zone, this is a range-bound chop — not a trending setup yet.
📌 Key Levels to Watch:
$204.98 – Gamma ceiling and top of supply
$203.21 – Structure pivot, minor resistance
$201.17 – Local midpoint and breakout base
$199.50 – Demand edge, current support
$197.50 – HVL and gamma support zone
$195.00 – 2nd PUT Wall
$190.00 – Final gamma support if breakdown accelerates
✅ Thoughts and Monday Game Plan:
AAPL is one of the cleanest coil setups among the tech names heading into Monday. This type of structure doesn’t last long — expect expansion.
Wait for direction at open:
If we break $203.21 with volume, we ride toward $205–207 for a short-term gamma pop.
If price fails to break and loses $199.50, the fade to $197.50 or lower is likely.
This is not a time to anticipate — react to the move. Let the coil resolve and follow the breakout or breakdown.
Disclaimer:
This analysis is for educational purposes only. Always do your own due diligence, trade with a plan, and manage your risk carefully.

CoinbaseThere isn't much to add to my COIN analysis. Price hit just shy of the 1.618 and then reversed. Price dropped by almost 10% from that last high. This bodes well for the top being in and the irregular (B) wave pattern prevailing. We still have a lot of work to do to prove that is what is happening though. Until we can breach $277 followed by a breach of $232.85, we can't be for certain. Yes, we will have hints on the way down. However, these price points will be what confirms the pattern lower. As I said above, COIN has a lot of work to do to prove its intentions. This last move up I think is largely due to the end of the quarter, congressional legislation, and FOMO.
MACD is back to within the red trend lines and appears to be weakening to the downside. This shouldn't be too surprising given how far we fell last Friday. That move lower, has created a 3-wave move thus far. Another local low before starting a consolidation higher would create a 5-wave pattern bringing more clarity, but it isn't required.
Again, I don't want to see another high made above last Thursdays if (B) is to be correct. A new high itself doesn't invalidate an irregular (B), but it would cause me to become very skeptical of it.
When I said last week that COIN has a pivotal moment right in front of it, I wasn't kidding. It appears to have chosen a move lower for now, but it is not guaranteed to continue and we could always move higher again from here. Just be careful in whatever position you take, and use stops to protect your assets.

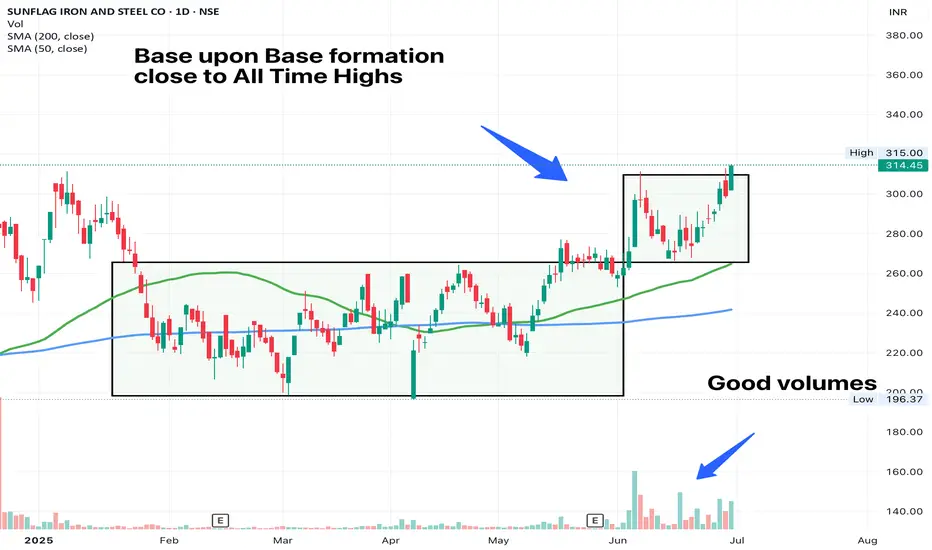
SUNFLAG - Base on Base FormationAnother set-up in the metals space. After Welcorp, LloydSME and APLApollo, this could be another favourable trade. The stock is attempting to breakout of the base today. Volumes have been good and the trend is already in place. Our job as a trader is to sit tight on structures till the trend lasts.
PALANTIR vs S&P500 INDEX. WILL AI UPBEAT TYCOON BUFFETT ITSELFFar far ago, somewhere in another Galaxy, in late December, 2024 (yet before The Second Coming of Trump), @TradingView asked at it awesome Giveaway: Happy Holidays & Merry Christmas.
1️⃣ What was your best trade this year?
2️⃣ What is your trading goal for 2025?
Here's what we answered:
1️⃣ What was your best trade this year?
- Surely Palantir NASDAQ:PLTR 💖
I followed Palantir all the year since January, 2024, from $16 per share, watch here .
Current result is 5X, to $80 per share.
Also I added more Palantir after SP500 Index inclusion in September 2024 watch here .
Current result is 2.6X, from $30 to $80 per share.
2️⃣ What is your trading goal for 2025?
- Once again, surely Palantir NASDAQ:PLTR 💖
It's gone 6 months or so... (Duh..? Ahaha.. 6 months already, really? 😸😸😸)
Let see what's happened next at the main graph PLTR/SPX
First of all, let me explain in a few words what does this graph mean.
Rising (Blue) candle means Palantir PLTR monthly return is better vs SPX
Falling (Red) candle means Palantir PLTR monthly return is worse vs SPX
Conclusion
Palantir. The stock that outperformed S&P 500 Index, 12 consecutive months in a row.
Palantir. The stock that printed 12x since inception. 5.5x over the past twelve month and 1.8x in the year 2025 (one the best results so far over the all S&P 500 Index components).
Palantir. The stock that goes to UPBEAT Tycoon Buffett record, that has been achieved in early 1990s (in 1992-93 Berkshire Hathway outperformed S&P 500 Index for straight TWELVE MONTHS).
Palantir. The stock that goes to repeat Microsoft NASDAQ:MSFT record, that has been achieved in 1990s (in 1996-97 Microsoft outperformed S&P 500 Index for straight THIRTEEN MONTHS).
Palantir. Were we right with this stock on contest and won it? Exactly! Even though our prize has been toadly strangled. 🤭
//P.S. We did not find any biggest series then 13-month straight gain. Microsoft 13 straght months superiority over S&P500 index is the biggest ever series in history we found.
//P.P.S. Just one day left (June 30, 2025) to a very potential and a very historical event.
--
Best wishes,
Your Beloved @PandorraResearch Team 😎

IPAK | Bullish MomentumAfter the break out of the descending trendline, IPAK price is retesting it for forming support. Upon successful reversal candle pattern, a next bullish wave towards ATH will be around 25 - 25.25.

Nvidia - New all time highs!Nvidia - NASDAQ:NVDA - breaks out now:
(click chart above to see the in depth analysis👆🏻)
Within two and a half months, Nvidia rallied more than +70%. Following this recent bullish strength, a retest of the previous highs was totally expected. But this does not seem to be the end at all. There is a much higher chance that we will see new all time highs soon.
Levels to watch: $150
Keep your long term vision🙏🙏
Philip (BasicTrading)

The King Roars AgainRS Rating of 95
Breaking out of key pivotal zone
Wall of Buyers displaying institution appetite
RTX 5000 Series debuted at a very friendly consumer price
Looking forward shows no signs of decelerating growth prospects for the Wall Street darling
I have reasons to believe this security price can increase in value

TSLA Bearish Breakdown in Progress – $322 or Bust? TSLA Bearish Breakdown in Progress – $322 or Bust? Monday Puts On Watch 🔻
🧠 GEX-Based Options Sentiment:
Tesla is currently trading right at a critical GEX flip zone. The $330 level used to be gamma support but has now broken, leaving TSLA vulnerable to a drop toward the high-risk gamma pocket between $320–$310.
The Highest positive GEX zone was stacked near $330–$340, but that structure has failed. The gamma walls above—like $347.5 and $350—now serve as resistance, especially with no strong call flow to support a squeeze.
The downside gamma structure is open. $310 is a soft magnet, but $300 is where the largest negative GEX sits, along with the 2nd and 3rd Put Walls. If TSLA continues slipping, a drop into the $300 zone could be swift.
Implied Volatility Rank is at 25.2, with IVX above 68 — meaning options are expensive, so spreads are safer than naked calls or puts. Flow is still 8% call-heavy, but that can flip hard if Monday starts red.
🔧 Options Trade Setup (for Monday–Wednesday):
Bearish Scenario (favored setup):
If TSLA opens weak or rejects $325–$327.50 area again, consider buying a PUT debit spread, such as 322p/310p or 320p/300p (July 3 expiry).
Target zone: $312, then $300 gamma flush.
Stop: reclaim of $331 with bullish momentum.
Bullish Scenario (lower probability):
If TSLA reclaims $330 and breaks trendline toward $335, consider a CALL debit spread like 335c/345c (Jul 3).
Target zone: $345–$350.
Cut if it falls back under $327.50.
📉 Intraday Technical Breakdown (1H Chart):
The price has confirmed a CHoCH + BOS combo, rejecting from supply and pushing below the rising trendline. Friday’s recovery attempt stalled right under that broken structure, and sellers took over late day.
The 1H chart is forming a bearish descending channel, with price currently trying to bounce off short-term demand, but failing to reclaim the key mid-zone.
This current setup favors continuation lower unless bulls can pull off a breakout early Monday. Otherwise, the path of least resistance is down.
📌 Key Levels to Watch:
$330.00 – Former GEX support, now resistance
$331.10 – Trendline and bearish trigger flip
$322.00 – Key support line (last defended Friday)
$320.00 – Gamma pivot zone
$310.00 – GEX magnet and low-volume shelf
$300.00 – Highest negative GEX and major PUT support zone
$345.25 – Upper trendline + prior supply rejection
✅ Thoughts and Monday Game Plan:
TSLA is sitting on the edge of a breakdown. The gamma structure supports further downside as long as price stays below $330. Watch for early rejection at $325–$327.50 to initiate puts.
If bulls manage to gap and reclaim above $331, reassess for a reversal setup — but for now, structure, volume, and GEX are all pointing down.
This is a reactive trade — wait for early confirmation on Monday and ride the wave, especially if SPY opens weak.
Disclaimer:
This analysis is for educational purposes only and not financial advice. Always trade with proper risk management and do your own due diligence.

Super performance candidate NASDAQ:SOFI has shown strong quarterly earning's growth, with its latest earnings quarter reporting 30% YoY, improving from losses to profits at an impressive rate
Being positioned as a Leader in the FinTech sector and significant institutional adoption, reflecting investor appetite and confidence
Aiding with a key Breakout day,
I have reasons to believe this security price could increase.

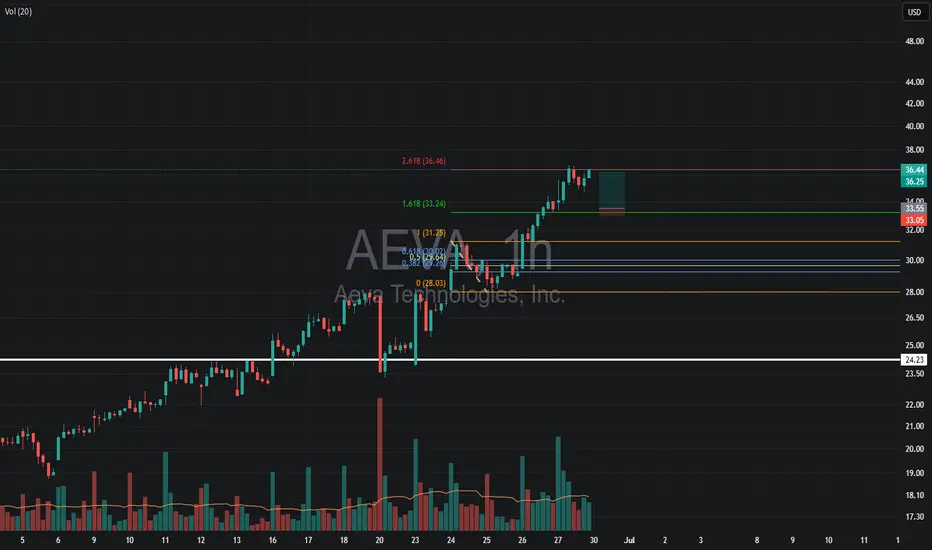
AEVA – Planning a Pullback Entry in a Strong UptrendWhy I Like This Setup:
Powerful daily uptrend — momentum clearly to the upside
Buyers stepping in on every dip — strong demand showing up consistently
Game Plan:
Entry Zone: Watching the 1.618 fib level for a pullback and bounce
Stop: Just below that 1.618 fib — clean invalidation point
Target: Previous high, but with this strength, I’ll likely use a trailing stop once price moves in my favor
Letting the trend do the heavy lifting on this one