$IREN Long Setup – Ichimoku Cloud Breakout with MACD Momentum IREN is setting up for a strong long opportunity on the daily chart, showing clear bullish structure and momentum. Price has broken above the Ichimoku Cloud with confirmation from both Tenkan-sen and Kijun-sen alignment, and the future cloud remains bullish. This breakout has held for several weeks now, with consistent higher highs and higher lows forming since the April bottom. The MACD is also supporting the move, with both the MACD line and histogram in bullish territory and no immediate signs of bearish divergence. The setup presents a clean risk/reward profile: entry at $10.67, stop at $9.09 just below recent support and Tenkan-sen, and a target at $16.25, which aligns with the R2.5 pivot zone and historical resistance from mid-2023. That’s a risk/reward ratio of 3.53. Volume has been steadily building on up days, suggesting institutional accumulation. If price breaks and holds above the $11.25 pivot (R1), expect continuation toward the next resistance levels at $16.25 and potentially $19+. I’m viewing this as a 2–6 week swing trade based on the daily chart structure and overall trend.

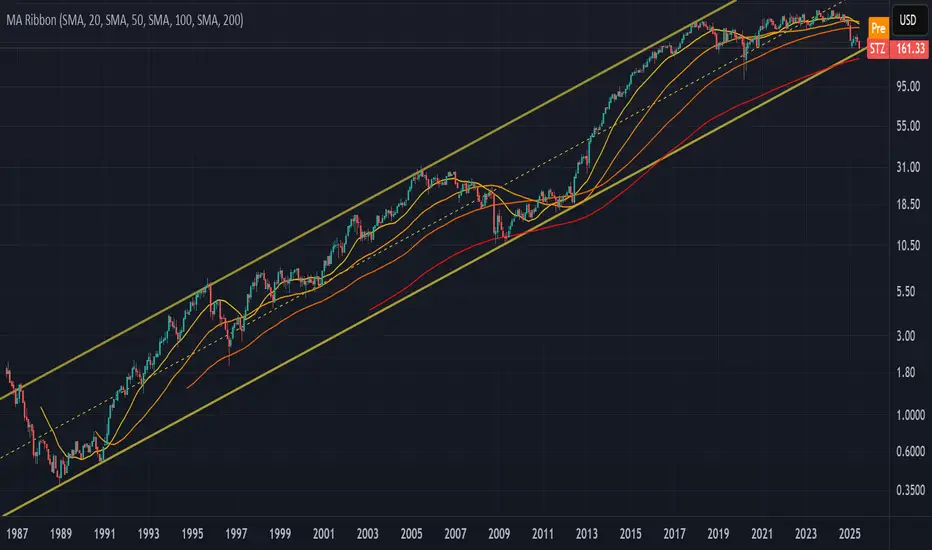
Constellation brands looks very interestingBerkshire Hathaway bought 27% higher, and doubled down in Q1 of this year, so I would assume the fundamentals are good.
But I am a technical swing trader, and I really like the technicals here. We could be close to forming a macro bottom, and so I might just hold this one for many many years. A DCA strategy would be perfect to enter here. Let me tell you a bit more about what I see on the charts:
TESLA falling down to 250 USD?Tesla is consolidating in a tight range, showing bearish pressure near the lower boundary of the formation. Moving averages (MA 5/10/30/60) are flattening, indicating a loss of bullish momentum, while the Wavetrend oscillator has issued a sell signal (bearish crossover below the zero line). A downside breakout from this range projects a potential move toward the $250 level, as illustrated by the measured move. This bearish scenario gains validity if price breaks below the $315 support level.
Possible TP: 250 USD

CIRCLE Stablecoin Revolution Circle is more than a crypto firm—it’s building infrastructure for a regulated digital dollar economy. With transparent reserves, global licenses, deep financial integrations, and robust blockchain functionality, USDC is rapidly positioning itself as a cornerstone of future finance.
I see a longer term potential for a great investment opportunity given the coming banking revolution involving stable coins.
For a lower risk entry, after a nearly 40% decrease in less than a week, the stock price is currently supported at the VWAP from the original IPO release.
Should the trend continue higher, I would prefer to see a bounce here on the stock.

Amazon getting ready for another leg downAmazon is now in consolidation mode right below the 200MA which also happens to line up with a previous area of resistance. As long as it continues to consolidate below the 200MA, look for another leg down. If it breaks above the 200MA and closes an entire candle above then that would cancel the bearish set up.
Nothing good ever happens below the 200

$RDDT Long Setup – Bullish BreakoutReddit ( NYSE:RDDT ) has broken out above the Ichimoku Cloud on the daily chart, signaling a potential shift in trend. Momentum is building with MACD pushing higher and no signs of divergence, showing continued strength. While this trade offers a solid 2.1 risk/reward setup (entry at $134.14, stop at $108.80, target at $188.34), the current entry is not ideal—price is extended from support, and the breakout has already moved significantly. However, the structure still points to bullish continuation. If RDDT can hold above the $130–$135 zone, there’s room to run into the $180s and potentially beyond. A pullback toward the breakout zone would offer a stronger entry, but the upside here remains attractive for a swing trade. This setup is best approached with smaller size or added confirmation if chasing.

ICICI Prudential Life Insurance BuyICICI Prudential Life Insurance jumped back from its channel support. Also it break above its recent resistance line. Small return trade. Buy @CMP (648) with SL of 640 and target of 665 and 675. Long-term target is 730.

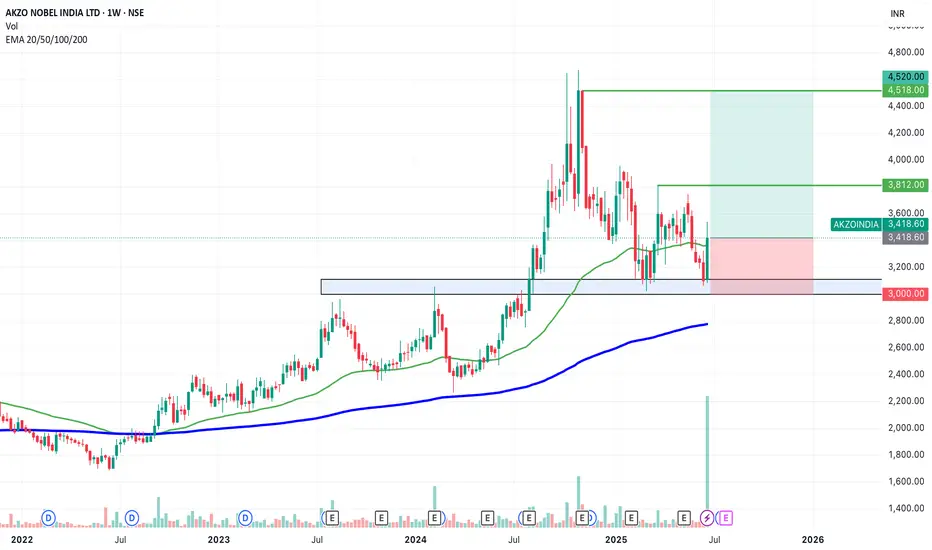
SWING IDEA - AKZO NOBEL INDIA Akzo Nobel India , a subsidiary of the global paints and coatings giant AkzoNobel N.V., is a leading player in India’s decorative and industrial paints market. Known for its premium brand Dulux , the company has strong brand recall, a wide distribution network, and consistent profitability.A strong brand, steady margins, and a bullish chart make this a candidate to watch for a short- to medium-term swing trade.
Reasons are listed below :
Bullish engulfing candle spotted on the weekly timeframe, signaling a potential trend reversal.
Accompanied by the highest-ever volume spike, adding strong conviction to the move.
Price is bouncing off the golden Fibonacci support (0.618), a classic retracement zone where strong reversals often occur.
The level of 3100 acted as a solid support.
The stock is trading above its 50 & 200 EMA on the weekly chart — a sign of long-term strength.
Target - 3812 // 4520
Stoploss - weekly close below 3000
DISCLAIMER -
Decisions to buy, sell, hold or trade in securities, commodities and other investments involve risk and are best made based on the advice of qualified financial professionals. Any trading in securities or other investments involves a risk of substantial losses. The practice of "Day Trading" involves particularly high risks and can cause you to lose substantial sums of money. Before undertaking any trading program, you should consult a qualified financial professional. Please consider carefully whether such trading is suitable for you in light of your financial condition and ability to bear financial risks. Under no circumstances shall we be liable for any loss or damage you or anyone else incurs as a result of any trading or investment activity that you or anyone else engages in based on any information or material you receive through TradingView or our services.
@visionary.growth.insights
Long Kraken Robotics PNG.V as Wave 5 unfoldsHere triangle is going to end its formation very soon and a break to the upside is expected to unfold the green wave 5.
Triangle is a type of correction that always precedes the final movement in the larger trend.
If assume that wave 5 will be the same length (as waves 1 and 3 are equal in length), the price will go above 6 CAD.

$BullShowing bullish signs
Wedge formation breaking up
Possible retest of wedge for entry
Loading shares under 11$

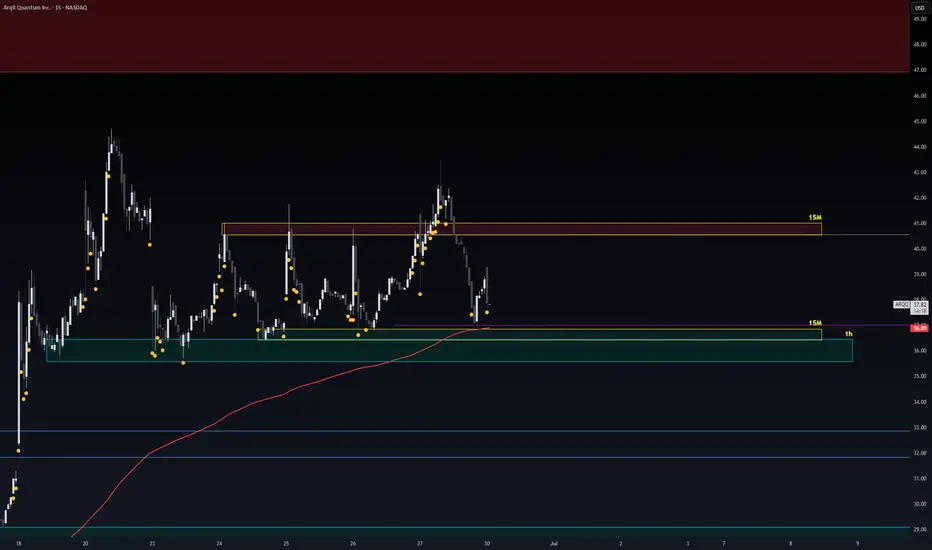
Scalp ARQQ Safe EntryZone Part-4Quantum stocks in free money Ranging Zone.
15M Zone Green is buy.
15M Zone Red is sell.
Note: 1- Potentional of Strong Buying Zone:
We have two scenarios must happen at The Mentioned Zone:
Scenarios One: strong buying volume with reversal Candle.
Scenarios Two: Fake Break-Out of The Buying Zone.
Both indicate buyers stepping in strongly. NEVER Join in unless one showed up.
2- How to Buy Stock:
On 15M TF when Marubozu Candle show up which indicate strong buyers stepping-in.
Buy on 0.5 Fibo Level of the Marubozu Candle, because price will always and always re-test the
PLEASE Note: its more dangerous now wait for buying power to show up already gained over 40% profit from ranging movement the resistance and supports getting weaker now
This may look like a repost of yesterday's idea - it's not.As tempting as it was today to choose TSLA and profit from the middle school girl drama that is Elon and DJT today, I’ll wait until the dust settles on that one to profit from it. Yes, the chart here for CME looks almost identical to the one for TW in the idea I posted yesterday. Hopefully, the outcome will be the same.
CME's performance with my algo has been stellar historically, and with a chart like this, it shouldn't be surprising. Its returns have been eerily similar as well. Overall, it has a 682-1 record with my algo (per usual, the 1 is from a signal yesterday). Average gain is 1.33% and the average holding period here is 17 days. Not quite 2x the average daily return in the market. Not huge, but very reliable.
So, long at 274.90 is the call here. Maybe FPC close, maybe not. The results above are based on FPC, however.
As always - this is intended as "edutainment" and my perspective on what I am or would be doing, not a recommendation for you to buy or sell. Act accordingly and invest at your own risk. DYOR and only make investments that make good financial sense for you in your current situation.

$APP Long Setup – Bullish Reversal Attempt off Key SupportApplovin ( NASDAQ:APP ) is attempting to base and reverse off the lower range of its cloud structure after a sharp pullback from highs above $400. Price is holding just under the cloud but showing early signs of curling higher. Despite bearish MACD pressure, momentum is beginning to decelerate, and a bounce here could offer strong upside.
Current setup offers a 2.83 risk/reward:
Entry: $341.03
Stop: $308.00 (below recent low)
Target: $434.44 (back to breakdown zone)
This is a countertrend play unless the price can reclaim and hold above the cloud. If it clears $360–$370 with volume, it opens the door to $400+. For now, this is a speculative long with a tight invalidation point and plenty of upside.
Are you buying this bounce or waiting for trend confirmation?

Short idea: INMB (WILL NOT WORK)Inmune Bio originally focused on using a dominant-negative TNF protein (DN-TNF) for cancer immunotherapy, which failed to show efficacy. Now, they’ve pivoted to neurology—repurposing the same molecule (XPro1595) for Alzheimer’s. The science behind targeting neuroinflammation is still early, and their approach lacks robust clinical validation.
They're in Phase 2, but data is sparse, the trial is small, and biomarkers—not clinical outcomes—are the main readout. With limited cash (~$20M as of last filing) and a high burn rate, they’ll likely need to raise before any real catalyst hits. High risk of dilution, weak scientific precedent, and a recycled failed asset = recipe for another disappointment.
Conclusion: This Alzheimer’s pivot feels like a Hail Mary. Market’s giving them credit for a turnaround that probably won’t work again ❌

Safe Entry Zone TOSTNote: Switch to 1H TF for better View and more details
Stock Current Movement Ranging.
4h Green is buy Zone stop loss Below.
4h Red Is Resistance Zone.
P.High Lines (Previous High) Consider as Strong Resitances!
Also My Beloved CAthie Wood BEST INVESTOR All Time (based on statics better than Warren Buffet Entire Histroy) Is BUYING!
Note: 1- Potentional of Strong Buying Zone:
We have two scenarios must happen at The Mentioned Zone:
Scenarios One: strong buying volume with reversal Candle.
Scenarios Two: Fake Break-Out of The Buying Zone.
Both indicate buyers stepping in strongly. NEVER Join in unless one showed up.
2- How to Buy Stock:
On 15M TF when Marubozu Candle show up which indicate strong buyers stepping-in.
Buy on 0.5 Fibo Level of the Marubozu Candle, because price will always and always re-test the

IDFC First Bank BuyIDFC FIrst Bank taking support at trend line. Although it is nearing a resistance line, it is likley break above as there are double test of the trend line as well as higher high and higher low formation. Buy @CMP (72) with SL of 69 and target of 75 & 85.

ADOBE MONEY SNATCH! High-Reward Long Setup (Police Trap Alert!)🚨 ADOBE HEIST ALERT: Bullish Bank Robbery Plan! (High-Risk, High-Reward Loot) 🚨
🌟 ATTENTION, MARKET PIRATES & MONEY SNATCHERS! 🌟
(Hola! Bonjour! Marhaba! Hallo!)
🔥 THIEF TRADING STRATEGY 🔥 – ADOBE INC. (ADBE) is primed for a bullish heist! Time to steal profits like a pro!
🔓 ENTRY POINT: "BREAK THE VAULT!"
"The loot is unguarded!" – Go LONG at any price, but for smarter robbers:
Set Buy Limit orders (15m/30m recent swing levels).
ALERT UP! Don’t miss the heist signal!
🛑 STOP-LOSS: "ESCAPE ROUTE!"
Thief SL: Nearest 2H nearest Swing Low (Adjust based on your risk tolerance & lot size).
Police (Bears) are lurking – Don’t get caught!
🎯 TARGET: 440.00 (OR BAIL BEFORE THE COPS ARRIVE!)
Scalpers: Stick to LONG side only!
Big Bankroll? Charge in! Small stack? Join the swing robbers!
Trailing SL = Your Getaway Car!
📢 WHY ADOBE Inc?
🐂 Bullish momentum + Overbought but greedy!
🚨 High-risk Red Zone – Trend reversal? Police trap? Bears are strong here!
💸 "Take profits & TREAT YOURSELF – You earned this loot!"
📡 STAY SHARP, THIEF!
Fundamentals, News, COT Reports, Geopolitics – CHECK THEM! (Linkkss ☝👉👆👉).
Market shifts FAST! Adapt or get caught holding bags!
⚠️ WARNING: NEWS = VOLATILITY TRAP!
Avoid new trades during news!
Trailing stops = Your bulletproof vest!
💥 BOOST THIS HEIST! 💥
"Like & Boost = Stronger Robbery Crew!"
💰 More boosts = More profit heists! 🚀
Stay tuned… Next heist coming soon! 🏴☠️🤑

COST Daily Chart Analysis: Key Levels, and Price StructureCostco Wholesale Corporation (COST)
Historical Context and Trend Channel:
From September 2024 through early 2025, COST was observed trading within a well-defined upward channel (indicated by the grey shaded areas). This channel represented a consistent bullish trend during that period. However, the price subsequently broke below the lower boundary of this channel around March 2025, suggesting a shift in the established trend.
Key Price Levels Identified:
Strong Support Level (870 to 880): Marked by the light blue shaded zone, this level has historically acted as a robust floor for the price, demonstrating strong buying interest on multiple occasions.
Good Level (930 to 940): The orange shaded area indicates an intermediate support zone. Should the immediate support fail, this level could come into play as the next area of interest for potential buyers.
1st Support (970 to 980): This green shaded area represents the most immediate support level based on recent price action. The price has recently found support within this range.
Key Resistance (1010): The horizontal red line with circled points highlights a critical overhead resistance level. This level has seen prior rejections, making it a significant hurdle for any sustained upward movement. It also appears to act as a potential "neckline" for current price formations.
Target (1060 to 1070): The red shaded zone at the top represents a significant resistance area and a prior peak. If the "Key Resistance -1010" is overcome, this zone could become the next potential target.
Recent Price Action and Pattern Observations:
Following the break from the long-term uptrend channel, COST rallied to form a peak around the "Target 1060 to 1070" zone in May. The subsequent decline from this peak, followed by a bounce and another attempt at the "Key Resistance -1010" level, suggests the formation of a potential "M" top or double top pattern if 1010 holds. More recently, the price has pulled back to test the "1st Support 970 to 980" zone. The current price action around 988.07 indicates that COST is trading between this immediate support and the "Key Resistance -1010" level. The chart illustrates two potential paths (dotted blue lines):
1. A move upward, challenging and potentially breaking above the "Key Resistance -1010" to target the 1060-1070 zone. This would align with a potential bullish "W" pattern formation if the 1st support holds.
2. A decline to retest the "Good Level 930 to 940" before a potential rebound.
The "Key Resistance -1010" level remains pivotal. A sustained break above it could signal further upside, while rejection from this level could lead to a retest of lower support zones.
Disclaimer:
The information provided in this chart is for educational and informational purposes only and should not be considered as investment advice. Trading and investing involve substantial risk and are not suitable for every investor. You should carefully consider your financial situation and consult with a financial advisor before making any investment decisions. The creator of this chart does not guarantee any specific outcome or profit and is not responsible for any losses incurred as a result of using this information. Past performance is not indicative of future results. Use this information at your own risk. This chart has been created for my own improvement in Trading and Investment Analysis. Please do your own analysis before any investments.

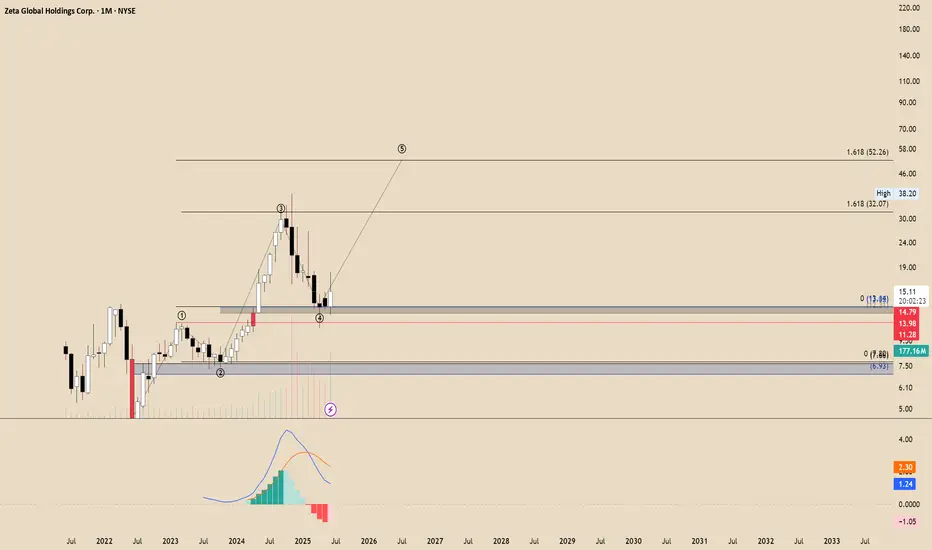
ZETA wave 5?Zeta appears to be forming the structure for a final Wave 5 (Elliott Wave Theory). Why? Let's analyze: Wave 2 showed only a shallow retracement, falling between 38–50%. However, Wave 3 extended to 1.618, indicating strong momentum. The Wave 4 pullback did not invalidate Wave 1 (as confirmed on the line chart – monthly timeframe). Additionally, the MACD is showing convergence and providing bullish momentum.
As commonly understood, for Wave 5 to validate the Elliott setup, it must extend beyond the peak of Wave 3. Therefore, projections to 0.618 or even 100% of the previous impulse may not suffice to confirm this pattern. This leads to the conclusion that an aggressive extension to the 1.618 level is more likely.
NFA
$AAPL In ConsolidationNASDAQ:AAPL is consolidating here in a wedging pattern. I do not know which way this will resolve. But, since I rarely if ever short, I am looking on the long side of a trade. The thing I like about a consolidation pattern like this is, you know when you are wrong very quickly. My plan is to take a ¼ size long position if / when it moves above the 50 DMA (red) with a stop just below the most recent low (which would also correspond to dropping below the lower wedging trendline.
Then if it can break out over the upper downtrend line, I will look to build out my position. I thought this would be a good one to put on your watchlist. If you like the idea, please make it your own so that it fits within your trading plan.

Alphabet Inc. ($GOOGL) – SMC Reaccumulation or Trap?📍 Market Context
Alphabet just printed a strong impulsive bullish candle into premium territory, touching the 0.886 retracement level near $181.22 before rejecting. Price is now consolidating near the golden pocket retracement zone (~$176.48–175.39) after a high-volume breakout.
📊 Scenarios Mapped by VolanX DSS:
✅ Scenario A – Bullish Reaccumulation (65% Probability)
Price finds support near $175.39 (0.5 retrace) or equilibrium zone and absorbs supply.
Break above $178.53 reactivates bullish continuation toward:
T1: $181.22 (liquidity sweep)
T2: $184.84 (Fib extension target)
⚠️ Scenario B – Liquidity Trap & Distribution (35% Probability)
If $175.39 fails, watch for a deeper retracement into:
Equilibrium demand zones: $172.50 → $170.00
Accumulation reaction expected there, or invalidation if $168 breaks
📈 SMC Structure
CHoCH and BOS confirmed prior to impulse
Volume climax indicates potential liquidity shift
Premium zone at $180–181 may act as magnet for smart money
🎯 Execution Framework
Entry: Scalp long near $175.39–176.00 with tight stop
Invalidation: Close below $174.00 on volume
Target: $181.22 → $184.84
RRR: 2.5x–3.8x depending on confirmation at retest
💡 “Liquidity isn’t lost — it’s redirected.” – VolanX Protocol
🔐 Posted by WaverVanir International LLC under the DSS Smart Execution Model.
#GOOGL #Alphabet #SmartMoneyConcepts #VolanX #WaverVanir #BreakoutStrategy #LiquiditySweep #OptionsFlow #MarketStructure #RiskManagement #FibonacciStrategy

META-LOOKS STONGNASDAQ:META This is how I see the stock movement.
The setup looks strong, and after a minor correction, I expect the uptrend to continue. I’ve drawn my vision directly on the chart. Let’s see how the market reacts.

KEI FOR FURTHER ANALYSISKEI FOR FURTHER ANALYSIS
Thanks for stopping by.
All analysis here is done strictly from an investor’s perspective — focusing on risk, return, valuation, and potential upside.
The notes cover key details. I’ve backed every thesis with my own analysis — no fluff, just what matters to investors.
If you find the idea useful or have suggestions, feel free to leave a comment. Always open to fresh insights.
Kind regards,
Psycho Trader
