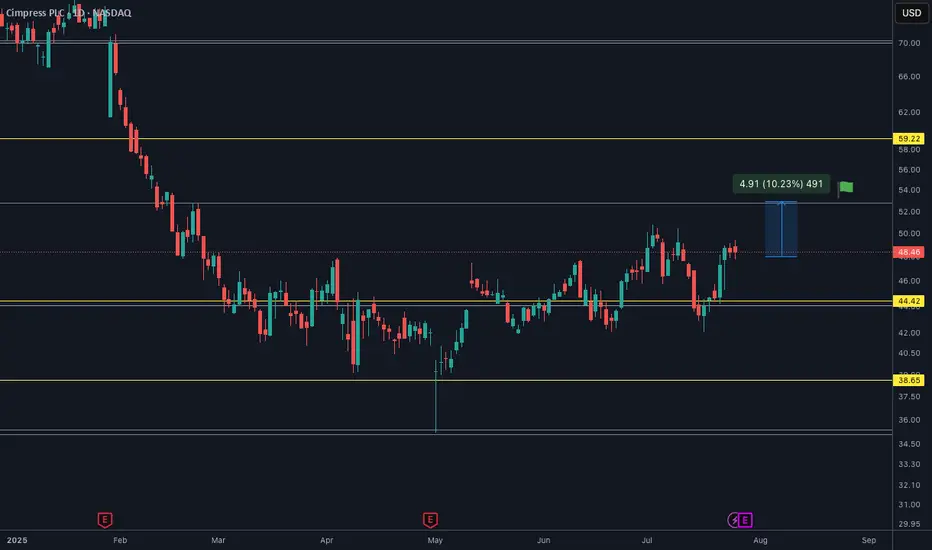
CMPR is ready for $53It will soon go to $53 I assume. Only question is quarterly releasing on 29th of July so in case things go wrong below $44 is not wanted.
GADT regaining strength to move UP GADT regaining strength to move UP and needs to be placed on watchlist. Important Supposts and Resistances marked on chart. the dotted lines are comparatively more important than the simple ones, please note. Light Red zone will hopefully be the first to getting achieved. Keep fingers crossed.

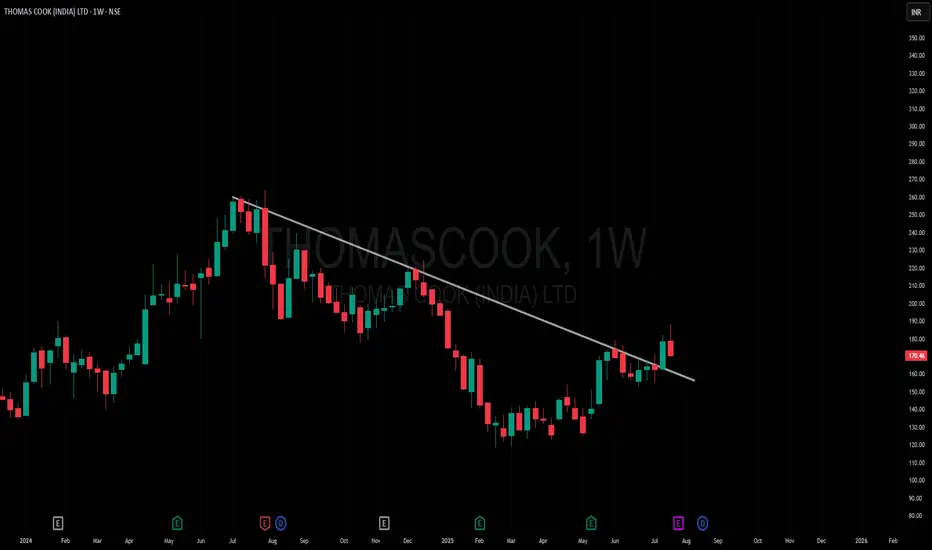
Amazing breakout on WEEKLY Timeframe - THOMASCOOKCheckout an amazing breakout happened in the stock in Weekly timeframe, macroscopically seen in Daily timeframe. Having a great favor that the stock might be bullish expecting a staggering returns of minimum 25% TGT. IMPORTANT BREAKOUT LEVELS ARE ALWAYS RESPECTED!
NOTE for learners: Place the breakout levels as per the chart shared and track it yourself to get amazed!!
#No complicated chart patterns
#No big big indicators
#No Excel sheet or number magics
TRADE IDEA: WAIT FOR THE STOCK TO BREAKOUT IN WEEKLY TIMEFRAME ABOVE THIS LEVEL.
Checkout an amazing breakout happened in the stock in Weekly timeframe.
Breakouts happening in longer timeframe is way more powerful than the breakouts seen in Daily timeframe. You can blindly invest once the weekly candle closes above the breakout line and stay invested forever. Also these stocks breakouts are lifelong predictions, it means technically these breakouts happen giving more returns in the longer runs. Hence, even when the scrip makes a loss of 10% / 20% / 30% / 50%, the stock will regain and turn around. Once they again enter the same breakout level, they will flyyyyyyyyyyyy like a ROCKET if held in the portfolio in the longer run.
Time makes money, GREEDY & EGO will not make money.
Also, magically these breakouts tend to prove that the companies turn around and fundamentally becoming strong. Also the magic happens when more diversification is done in various sectors under various scripts with equal money invested in each N500 scripts.
The real deal is when to purchase and where to purchase the stock. That is where Breakout study comes into play.
Check this stock which has made an all time low and high chances that it makes a "V" shaped recovery.
> Taking support at last years support or breakout level
> High chances that it reverses from this point.
> Volume dried up badly in last few months / days.
> Very high suspicion based analysis and not based on chart patterns / candle patterns deeply.
> VALUABLE STOCK AVAILABLE AT A DISCOUNTED PRICE
> OPPURTUNITY TO ACCUMULATE ADEQUATE QUANTITY
> MARKET AFTER A CORRECTION / PANIC FALL TO MAKE GOOD INVESTMENT
DISCLAIMER : This is just for educational purpose. This type of analysis is equivalent to catching a falling knife. If you are a warrior, you throw all the knives back else you will be sorrow if it hits SL. Make sure to do your analysis well. This type of analysis only suits high risks investor and whose is willing to throw all the knives above irrespective of any sectoral rotation. BE VERY CAUTIOUS AS IT IS EXTREME BOTTOM FISHING.
HOWEVER, THIS IS HOW MULTIBAGGERS ARE CAUGHT !
STOCK IS AT RIGHT PE / RIGHT EVALUATION / MORE ROAD TO GROW / CORRECTED IV / EXCELLENT BOOKS / USING MARKET CRASH AS AN OPPURTUNITY / EPS AT SKY.
LET'S PUMP IN SOME MONEY AND REVOLUTIONIZE THE NATION'S ECONOMY!
Mean Reversion Trade: PM1. RSI in oversold region
2. Price likely to rebound back the the mean
Trade Rules:
Entry Trigger - RSI has cross below oversold region, enter limit buy at close price
Exit Trigger - Close at market when close price cross above exit trigger (Red step line)

Indicator Decoded: RSI Mega Zones: Signals from the EdgeMost traders are familiar with the textbook RSI levels—70 indicating overbought and 30 indicating oversold. But markets, especially in strong momentum phases, do not always obey these boundaries. That is where the concept of Mega Overbought and Mega Oversold zones becomes vital. These are not fixed thresholds, but adaptive zones often beyond 80 and below 20, where the RSI reflects extreme strength or weakness. Rather than acting as reversal points, these levels often signal trend continuation.
A reading above 80 is typically seen during powerful uptrends or post-breakout rallies. It indicates not just buying, but unhesitating, aggressive demand, especially after key resistance zones have been cleared. Such RSI levels have often not been seen in several months—if not more than a year—making their appearance especially significant. Rather than a signal of exhaustion, this may be the start of a major trend, suggesting that the broader structure of the stock or index has shifted decisively. Traders who misinterpret this as a reversal signal often find themselves fighting momentum. Instead, price tends to grind higher, sometimes pausing briefly before further gains. This is why the chapter suggests using Mega Overbought zones as confirmation of bullish control, not a trigger for counter-trades.
The inverse applies to the Mega Oversold zone—RSI falling below 20. This is usually not a buy-the-dip moment, especially if the broader trend and chart structure are bearish. Such readings typically accompany panic-driven breakdowns, where sellers dominate without any counterforce. These extreme values are often rare and may not have appeared for months or even over a year, marking a moment where the market’s character may be undergoing a structural change. As with Mega Overbought, context is critical. If RSI hits such depths after prolonged distribution or a topping pattern, it does not indicate value—it confirms that the tide has turned, and a strong downtrend may be setting in.
Both Mega zones are best used in conjunction with structure—trendlines, volume shifts, anchored VWAP zones, or price patterns. The RSI alone is not enough. But when it aligns with other technical signals, a Mega Overbought or Oversold status becomes a momentum amplifier, not a contrarian prompt. In fact, your RSI chapter rightly warns that entering against such zones can be fatal unless clear divergences, climax patterns, or volume exhaustion are also present. Think of these extremes not as ceilings or floors, but as accelerators when backed by structure.
A word of caution: These signals are rare and often widely spaced. The real challenge lies in managing risk–reward, as strong momentum and shallow pullbacks can make it difficult to find entries with favourable R:R ratios.
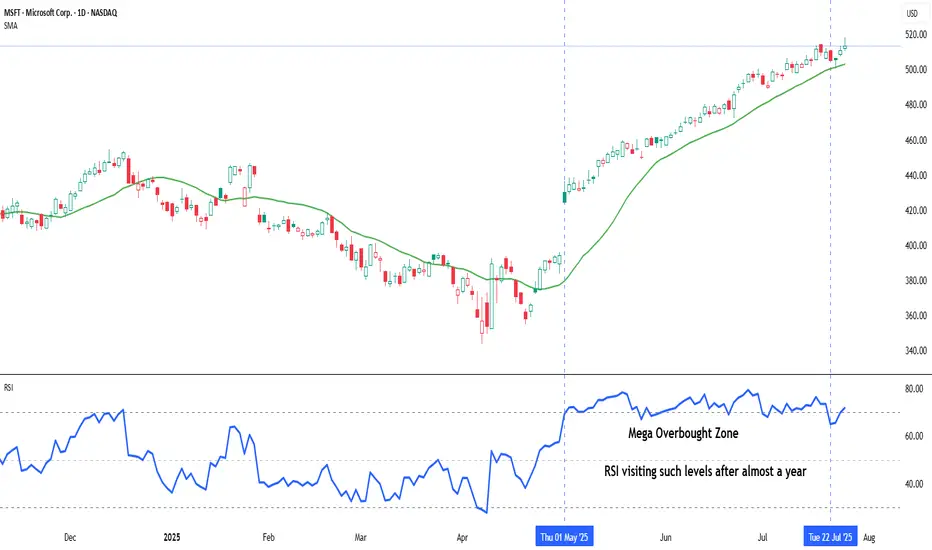
Chart: Microsoft Corp. (MSFT) – Daily Chart with 20-DMA and RSI (as on July 25, 2025)
Microsoft continues its strong upward trajectory, with price action staying well above the rising 20-day simple moving average. The recent surge in RSI into the mega overbought zone marks a significant shift in momentum, as the indicator revisits such elevated levels after nearly a year—an occurrence that often coincides with extended bullish phases.
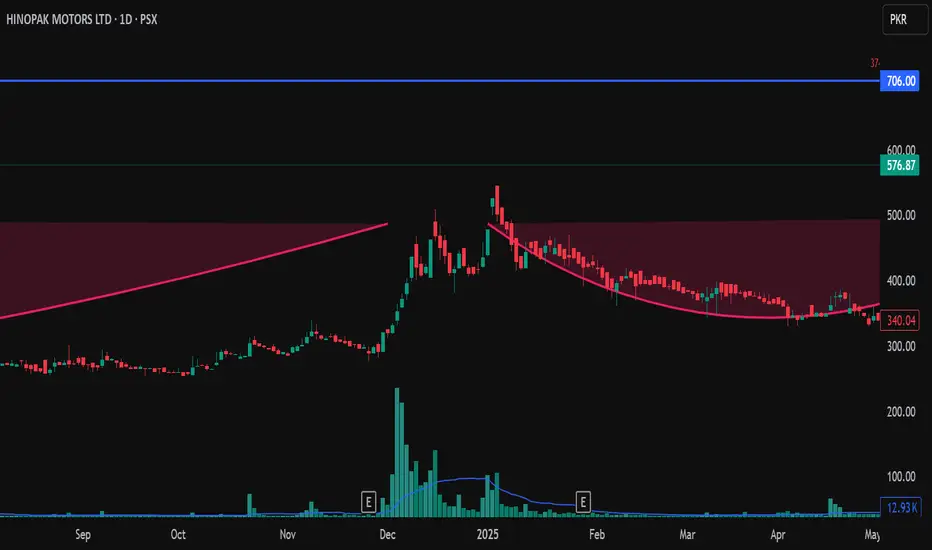
hinobuy at 522. and 470, tp 700. if you want detail plz ask. i m not writing much right now. stay cool
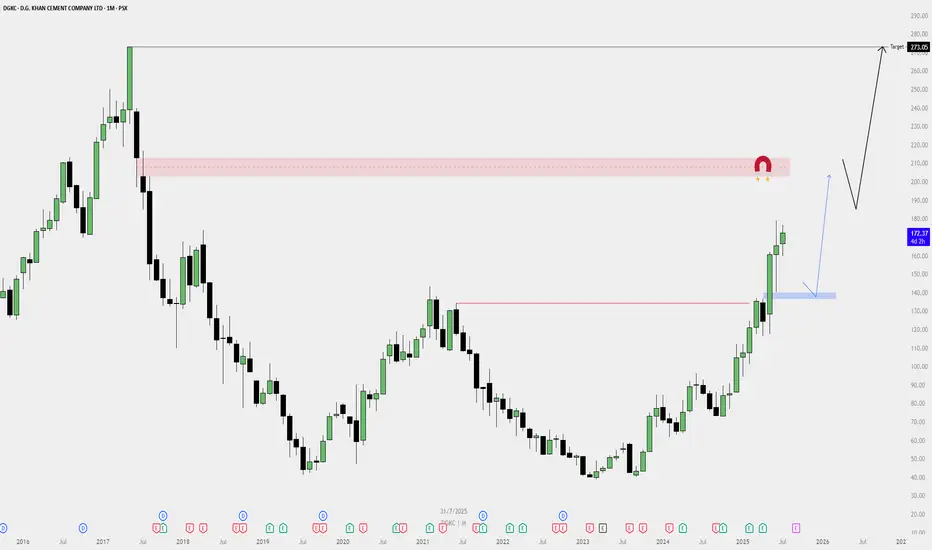
DGKC Monthly Buy Plan — Bullish Outlook📈 DGKC Monthly Buy Plan — Bullish Outlook
✅ Bias: Strongly Bullish
Price has broken major resistance levels with high momentum, forming a big bull trend on the monthly timeframe.
🔍 Key Observations:
Break of Structure:
Price broke past a major resistance zone (previous high).
Strong monthly green candles show institutional interest.
Demand Zone (Blue Box):
A fresh demand zone is formed — a possible area for pullback re-entry.
If price retests this zone, it may offer a high-probability long setup.
Liquidity Magnet Zone (Red Box):
A clear monthly imbalance / supply zone around the 210–220 range.
Could act as a temporary resistance before continuation.
Final Target:
Monthly inefficiency / liquidity target at 273.05, likely the final destination of the move.
Market structure suggests this level can be reached before any major reversal.
🔄 Plan Execution:
🔵 Scenario 1 (Pullback Entry):
Wait for a pullback to the blue demand zone.
Look for lower timeframe confirmation to enter long.
🔵 Scenario 2 (Momentum Continuation):
If price continues without deep pullback, consider smaller timeframes for continuation setups.
Do not chase price; wait for valid structure.
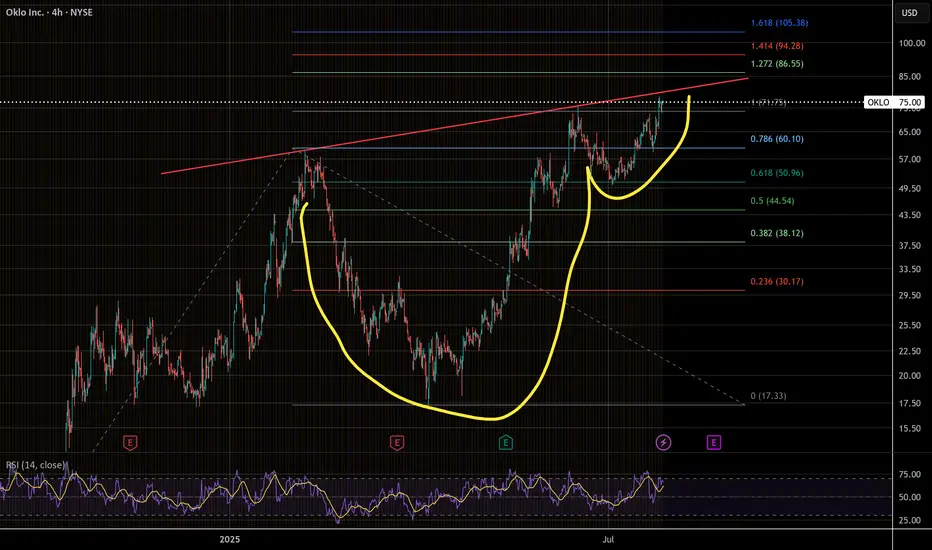
Cup and Handle, another leg up?Oklo is looking pretty decent, waiting for a break to confirm this momentum trade
Saudi Aramco Base Oil Co. (Luberef - 2223) on the Daily timefram🔻 Sell Plan Summary
🔴 Key Supply Zones:
Monthly Fair Value Gap (FVG) / Premium Supply Zone — (Red Box around 108–110 SAR)
Labeled as “M fvg T2,4” on your chart.
Price previously reversed from this zone, indicating strong selling pressure.
Daily Bearish FVG / Rejection Zone — (Red Zone around 104.5 SAR)
Price is reacting to this short-term supply area.
It hasn't closed above this zone, showing weak bullish momentum.
🔵 Target Zone:
Daily Bullish Fair Value Gap (FVG) — (Blue Box: 96.5–98.5 SAR)
This is your likely downside target, situated in the discount zone.
A strong demand area where price may find support.
📉 Market Structure:
Price formed a lower high, suggesting bearish structure.
Recent candles show rejections from supply, supporting a short bias.
The chart includes a red arrow showing expected downward movement.

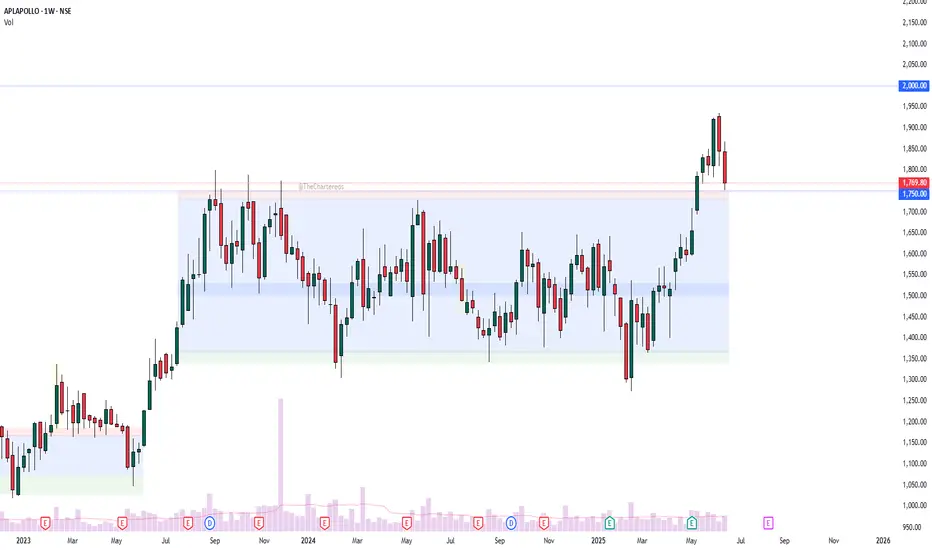
APLAPOLLO - retest phase?APL Apollo – Chart Analysis
The structure is quite clear:
Price consolidated within a tight range for nearly 2 years.
This was followed by a strong breakout accompanied by a notable volume spike.
Currently, the stock appears to be in the retest phase of the breakout zone.
Fundamental Trigger:
📢 APL Apollo Q4 Results: Net profit up 72% YoY; Board approves ₹1,500 Cr capex plan.
What’s next?
Will the retest hold and lead to the next leg up?
Let me know your thoughts 👇
Disclaimer: This analysis is for educational and informational purposes only. It is not investment advice or a recommendation to buy or sell any security. Please do your own research or consult a financial advisor before making any investment decisions. I am not a SEBI-registered advisor.
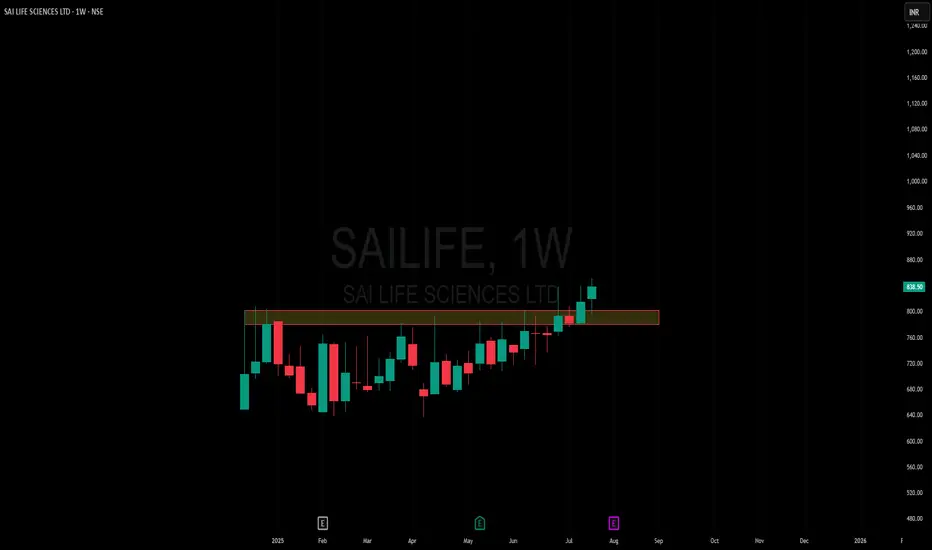
Amazing breakout on WEEKLY Timeframe - SAILIFECheckout an amazing breakout happened in the stock in Weekly timeframe, macroscopically seen in Daily timeframe. Having a great favor that the stock might be bullish expecting a staggering returns of minimum 25% TGT. IMPORTANT BREAKOUT LEVELS ARE ALWAYS RESPECTED!
NOTE for learners: Place the breakout levels as per the chart shared and track it yourself to get amazed!!
#No complicated chart patterns
#No big big indicators
#No Excel sheet or number magics
TRADE IDEA: WAIT FOR THE STOCK TO BREAKOUT IN WEEKLY TIMEFRAME ABOVE THIS LEVEL.
Checkout an amazing breakout happened in the stock in Weekly timeframe.
Breakouts happening in longer timeframe is way more powerful than the breakouts seen in Daily timeframe. You can blindly invest once the weekly candle closes above the breakout line and stay invested forever. Also these stocks breakouts are lifelong predictions, it means technically these breakouts happen giving more returns in the longer runs. Hence, even when the scrip makes a loss of 10% / 20% / 30% / 50%, the stock will regain and turn around. Once they again enter the same breakout level, they will flyyyyyyyyyyyy like a ROCKET if held in the portfolio in the longer run.
Time makes money, GREEDY & EGO will not make money.
Also, magically these breakouts tend to prove that the companies turn around and fundamentally becoming strong. Also the magic happens when more diversification is done in various sectors under various scripts with equal money invested in each N500 scripts.
The real deal is when to purchase and where to purchase the stock. That is where Breakout study comes into play.
Check this stock which has made an all time low and high chances that it makes a "V" shaped recovery.
> Taking support at last years support or breakout level
> High chances that it reverses from this point.
> Volume dried up badly in last few months / days.
> Very high suspicion based analysis and not based on chart patterns / candle patterns deeply.
> VALUABLE STOCK AVAILABLE AT A DISCOUNTED PRICE
> OPPURTUNITY TO ACCUMULATE ADEQUATE QUANTITY
> MARKET AFTER A CORRECTION / PANIC FALL TO MAKE GOOD INVESTMENT
DISCLAIMER : This is just for educational purpose. This type of analysis is equivalent to catching a falling knife. If you are a warrior, you throw all the knives back else you will be sorrow if it hits SL. Make sure to do your analysis well. This type of analysis only suits high risks investor and whose is willing to throw all the knives above irrespective of any sectoral rotation. BE VERY CAUTIOUS AS IT IS EXTREME BOTTOM FISHING.
HOWEVER, THIS IS HOW MULTIBAGGERS ARE CAUGHT !
STOCK IS AT RIGHT PE / RIGHT EVALUATION / MORE ROAD TO GROW / CORRECTED IV / EXCELLENT BOOKS / USING MARKET CRASH AS AN OPPURTUNITY / EPS AT SKY.
LET'S PUMP IN SOME MONEY AND REVOLUTIONIZE THE NATION'S ECONOMY!
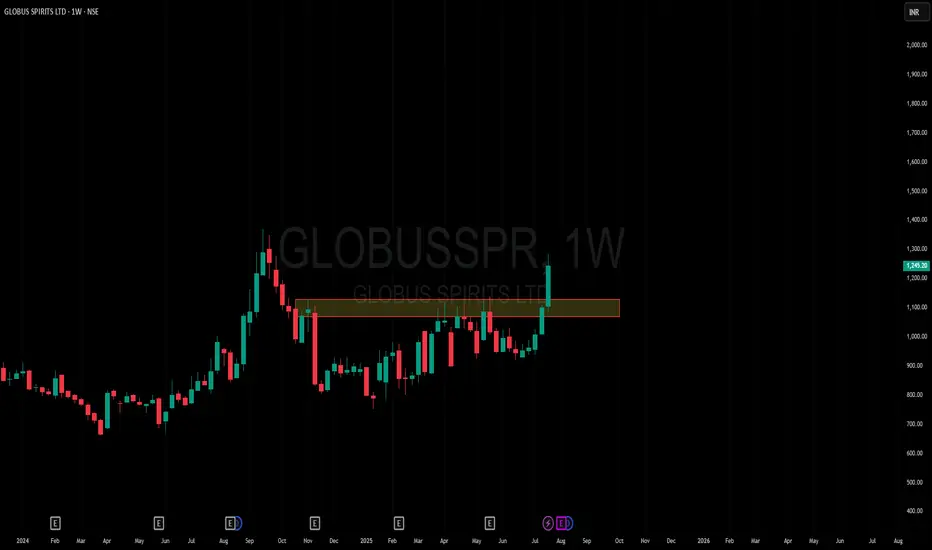
Amazing breakout on WEEKLY Timeframe - GLOBUSSPRCheckout an amazing breakout happened in the stock in Weekly timeframe, macroscopically seen in Daily timeframe. Having a great favor that the stock might be bullish expecting a staggering returns of minimum 25% TGT. IMPORTANT BREAKOUT LEVELS ARE ALWAYS RESPECTED!
NOTE for learners: Place the breakout levels as per the chart shared and track it yourself to get amazed!!
#No complicated chart patterns
#No big big indicators
#No Excel sheet or number magics
TRADE IDEA: WAIT FOR THE STOCK TO BREAKOUT IN WEEKLY TIMEFRAME ABOVE THIS LEVEL.
Checkout an amazing breakout happened in the stock in Weekly timeframe.
Breakouts happening in longer timeframe is way more powerful than the breakouts seen in Daily timeframe. You can blindly invest once the weekly candle closes above the breakout line and stay invested forever. Also these stocks breakouts are lifelong predictions, it means technically these breakouts happen giving more returns in the longer runs. Hence, even when the scrip makes a loss of 10% / 20% / 30% / 50%, the stock will regain and turn around. Once they again enter the same breakout level, they will flyyyyyyyyyyyy like a ROCKET if held in the portfolio in the longer run.
Time makes money, GREEDY & EGO will not make money.
Also, magically these breakouts tend to prove that the companies turn around and fundamentally becoming strong. Also the magic happens when more diversification is done in various sectors under various scripts with equal money invested in each N500 scripts.
The real deal is when to purchase and where to purchase the stock. That is where Breakout study comes into play.
Check this stock which has made an all time low and high chances that it makes a "V" shaped recovery.
> Taking support at last years support or breakout level
> High chances that it reverses from this point.
> Volume dried up badly in last few months / days.
> Very high suspicion based analysis and not based on chart patterns / candle patterns deeply.
> VALUABLE STOCK AVAILABLE AT A DISCOUNTED PRICE
> OPPURTUNITY TO ACCUMULATE ADEQUATE QUANTITY
> MARKET AFTER A CORRECTION / PANIC FALL TO MAKE GOOD INVESTMENT
DISCLAIMER : This is just for educational purpose. This type of analysis is equivalent to catching a falling knife. If you are a warrior, you throw all the knives back else you will be sorrow if it hits SL. Make sure to do your analysis well. This type of analysis only suits high risks investor and whose is willing to throw all the knives above irrespective of any sectoral rotation. BE VERY CAUTIOUS AS IT IS EXTREME BOTTOM FISHING.
HOWEVER, THIS IS HOW MULTIBAGGERS ARE CAUGHT !
STOCK IS AT RIGHT PE / RIGHT EVALUATION / MORE ROAD TO GROW / CORRECTED IV / EXCELLENT BOOKS / USING MARKET CRASH AS AN OPPURTUNITY / EPS AT SKY.
LET'S PUMP IN SOME MONEY AND REVOLUTIONIZE THE NATION'S ECONOMY!
Conservative Bullish Case for Eli Lilly: A Pharmaceutical LeaderEli Lilly (LLY) is currently trading at $812.95, having recently shown strength by climbing from the mid-$700s to over $800 in the past month. The stock has established a key support zone in the $760-780 range while testing resistance around the current price level.
Fundamental Strength
LLY's recent performance is backed by solid fundamentals:
Improving Profitability Metrics: The PE ratio has decreased from 135.9 in Q1 2024 to 70.2 in Q1 2025, indicating improved earnings efficiency despite the high valuation.
Strong Gross Profit Margins: Consistently maintaining margins above 80% (82.5% in Q1 2025), demonstrating pricing power and operational efficiency.
Impressive Earnings Growth: Q4 2024 showed a 113.7% year-over-year EPS growth, with Q1 2025 continuing the trend at 29.5% growth.
Return on Equity: Q1 2025 ROE of 17.4% shows efficient use of shareholder capital.
Catalysts for Continued Growth
Recent developments support a bullish outlook:
European Regulatory Progress: On July 25th, LLY received positive CHMP recommendation for donanemab in Alzheimer's treatment, opening a significant new market.
Product Innovation Pipeline: The FDA approved a new dosing schedule for Kisunla (donanemab) on July 9th, enhancing its safety profile while maintaining efficacy.
Pricing Strategy Optimization: LLY introduced flat-rate pricing for Zepbound at $499/month in June, potentially expanding market access.
Strategic Acquisitions: The company's $1.3 billion acquisition of Verve Therapeutics expands its portfolio into gene editing for cardiovascular disease.
Strong Analyst Support: 12 of 13 recent analyst ratings are "buy," with an average price target around $1,000, suggesting approximately 23% upside potential.
Technical Setup
The weekly chart shows LLY in a Stage 2 growth phase according to Weinstein analysis, with price consolidating after a strong uptrend. The recent price action has formed a potential base in the $760-780 range, with the stock now testing resistance.
Conservative Trade Approach
For investors seeking a measured entry into LLY:
Entry Strategy: Consider a partial position at current levels ($810-815) with plans to add on any pullbacks to the $780 support zone.
Position Sizing: Limit initial position to 50% of intended allocation to manage risk.
Stop Loss: Place a protective stop below the recent support at $760 (approximately 6.5% below current price).
Target: First target at $900 (10.7% upside), with potential for further gains to analyst consensus targets around $1,000 (23% upside).
Risk Management: The 3:1 reward-to-risk ratio makes this a favorable setup for conservative investors.
Risks to Consider
While the outlook is positive, prudent investors should be aware of:
Valuation Concerns: Despite PE ratio improvement, LLY still trades at a premium to the broader market.
Competition: Novo Nordisk and emerging competitors are advancing their own weight management and diabetes treatments.
Regulatory Scrutiny: Increased attention on GLP-1 drugs could impact growth trajectory.
Political Risk: Potential pharmaceutical tariffs under a new administration could affect margins.

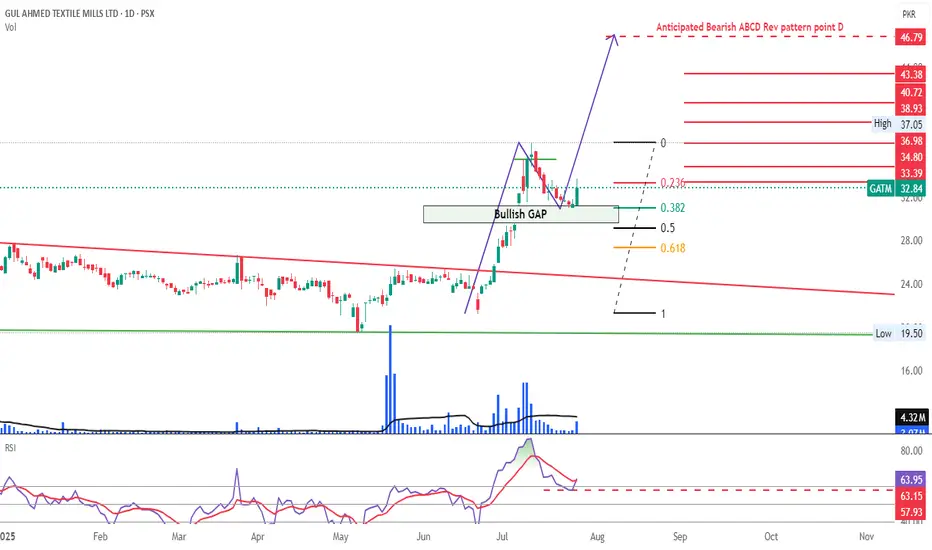
Watch GATM for LONG PositionScrip took a correction of 0.382 Fib and is on the move towards the upside.
Step wise immediate Resistances mentioned on chart along with a potential Bearish ABCD Rev TP of around 45-50.
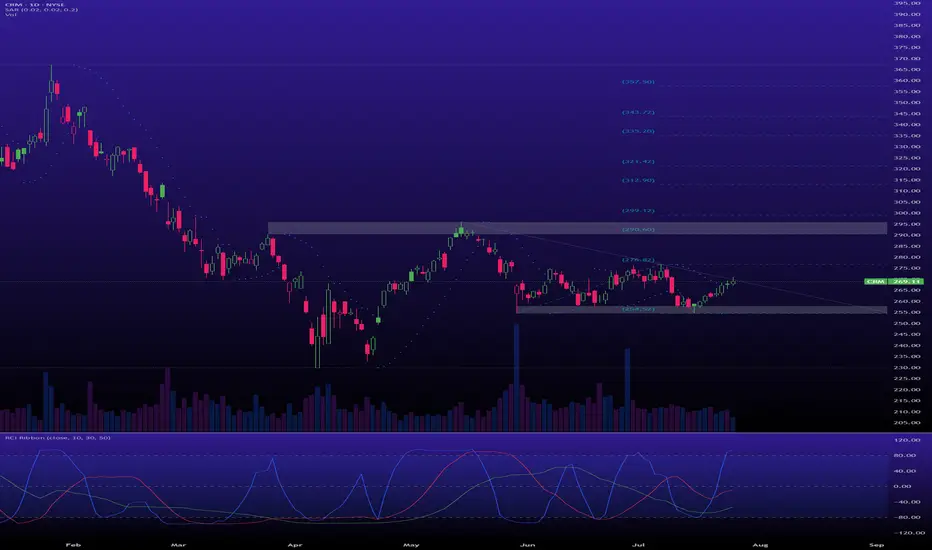
CRM is in an early accumulation phase of the Wyckoff methodWeekly Chart Analysis (The Secret Accumulation):
After a nasty markdown from the highs, CRM entered a wide trading range between roughly $230 and $290. This is classic Wyckoff Accumulation (Phase B) behavior.
Support & Resistance Levels
Next Week (July 28 - August 1, 2025):
Support: Immediate support lies around $265. The key pivot low to hold is $255.
Resistance: The first hurdle is the prior swing high around $275. The main target is the top of the accumulation range near $290.
Next Month (to end of August 2025):
Support: The entire structure is supported by the range low around $230.
Resistance: A breakout above $290 would confirm the start of a new markup phase (Phase D), with little resistance until well above $300.
Jindal SteelAnother strong candidate from the metal sector. Huge consolidation and VCP in ratio charts show that it can be good candidate provided metal sector start working

Tata SteelGood stock from the strong sector seems Tata Steel. It is under consolidation since long and not outperformed the NIFTY since long. Keep track.

EVER LongIf we get a pull back this is a pretty good risk reward, but it will probably break this range and head towards 33$
SL at 23.74
RDDT LongOn a pullback to 146 there is a 2.45 risk to reward setup
I like the volume accumulation here it seems prime to push out of this volume profile
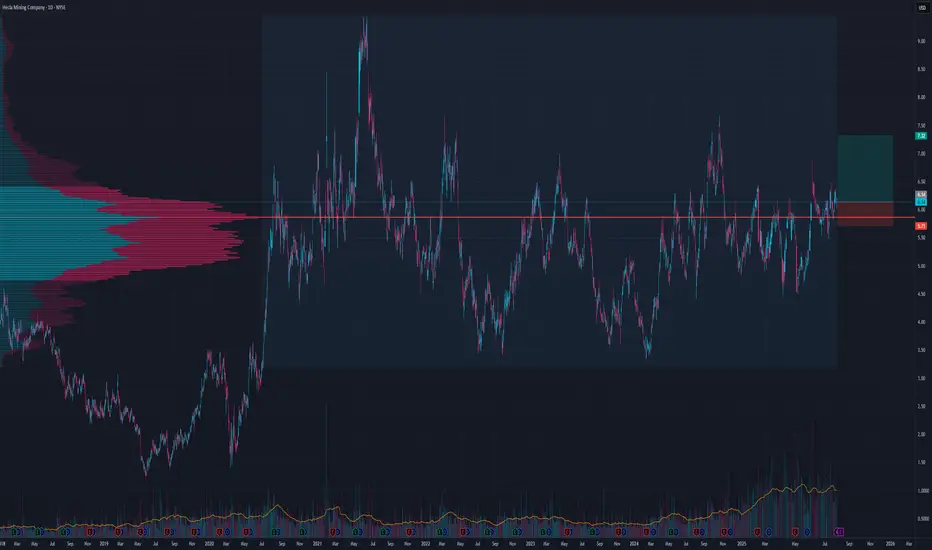
Another HL winner?I like this patter and potential push away from POC
Even tho tp could be higher and setup is still valid until 5.4 for a shorter term SL is at 5.7 and TP at 7.33 for a good risk to reward
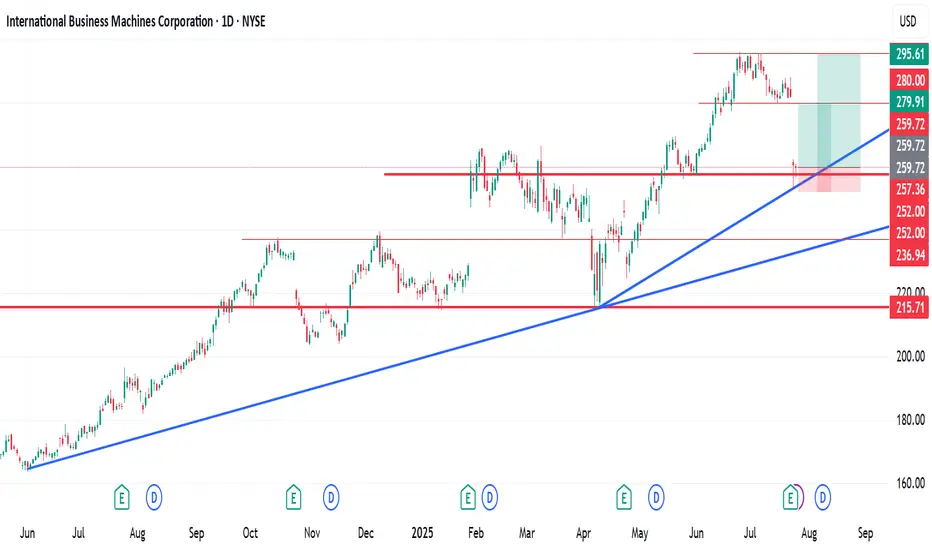
IBM Stock Forecast and Technical OutlookIBM Stock Forecast and Technical Outlook.
International Business Machines Corporation (IBM) reached a recent peak in June 2025 before experiencing a gradual decline. On July 24th, the stock saw a significant drop of over 10%, likely triggered by investor reaction to recent company news or broader market sentiment.
Despite this sharp decline, technical indicators on my chart suggest the potential for a short- to medium-term recovery. Based on my analysis, there are two potential setups with favourable Risk-to-Reward (R:R) ratios:
Scenario 1: R:R of 1:2.63
Scenario 2: R:R of 1:4.65
I bought some shares at $260.17
These figures indicate that for every unit of risk taken, there is a potential return of 2.63x or 4.65x, respectively, depending on the chosen entry and exit strategy.
As always, investors are advised to conduct their due diligence and apply proper risk management techniques before entering any position.
Hey friends, if this is helpful, kindly like, follow, subscribe, share and comment