Alphabet Inc. ($GOOGL) – SMC Reaccumulation or Trap?📍 Market Context
Alphabet just printed a strong impulsive bullish candle into premium territory, touching the 0.886 retracement level near $181.22 before rejecting. Price is now consolidating near the golden pocket retracement zone (~$176.48–175.39) after a high-volume breakout.
📊 Scenarios Mapped by VolanX DSS:
✅ Scenario A – Bullish Reaccumulation (65% Probability)
Price finds support near $175.39 (0.5 retrace) or equilibrium zone and absorbs supply.
Break above $178.53 reactivates bullish continuation toward:
T1: $181.22 (liquidity sweep)
T2: $184.84 (Fib extension target)
⚠️ Scenario B – Liquidity Trap & Distribution (35% Probability)
If $175.39 fails, watch for a deeper retracement into:
Equilibrium demand zones: $172.50 → $170.00
Accumulation reaction expected there, or invalidation if $168 breaks
📈 SMC Structure
CHoCH and BOS confirmed prior to impulse
Volume climax indicates potential liquidity shift
Premium zone at $180–181 may act as magnet for smart money
🎯 Execution Framework
Entry: Scalp long near $175.39–176.00 with tight stop
Invalidation: Close below $174.00 on volume
Target: $181.22 → $184.84
RRR: 2.5x–3.8x depending on confirmation at retest
💡 “Liquidity isn’t lost — it’s redirected.” – VolanX Protocol
🔐 Posted by WaverVanir International LLC under the DSS Smart Execution Model.
#GOOGL #Alphabet #SmartMoneyConcepts #VolanX #WaverVanir #BreakoutStrategy #LiquiditySweep #OptionsFlow #MarketStructure #RiskManagement #FibonacciStrategy

ACHR – 50 SMA Bounce with Sympathy Momentum from JOBYNYSE:ACHR – 50 SMA Pullback + Options Play Into Support
Archer Aviation ( NYSE:ACHR ) is showing signs of life right at the 50 SMA, and with competitor NYSE:JOBY ripping to new highs today on news, this could be the sympathy setup traders are looking for.
🔹 Technical Setup
After a strong run, NYSE:ACHR has pulled back in an orderly fashion, now resting on the 50-day moving average — a key support zone.
The stock is sitting on clean support, showing signs of stabilization.
🔹 Sector Tailwind from NYSE:JOBY
NYSE:JOBY is breaking out today on headlines — and NYSE:ACHR often moves in sympathy.
If momentum spills over, this could be the launchpad for NYSE:ACHR to retest prior highs.
🔹 My Trade Plan:
1️⃣ Position: Buying the August 1st $11 calls around the $0.90 area.
2️⃣ Reasoning: Strong reward-to-risk if NYSE:ACHR bounces from here.
3️⃣ Trigger: Watching for a reclaim of the short-term EMAs and increased volume as confirmation.
Why I Like This Setup:
50 SMA bounce + sympathy play = great combo.
Options are cheap, offering leverage without heavy risk.
If this breaks out again, it could move fast — this name has range.

"MINORITY" Report.. Miners making a move.. Often = "delayed" BTCCheck 1Y big picture.
BTC miners making their moves, interesting to see how they compare to each other.
Those 4 a picked for a reason: top 4 performers.
Interesting to see:
IREN @ RIOT topped 70-100%
MARA & CLSK still got "room" to run..
NFA but quite possibly not late to catch a train..

META Approaching Key Support – Healthy Pullback Setup?Meta (META) has been climbing within a rising wedge channel since April, recently stalling below $730. A potential short-term pullback is forming, which may offer a healthy reset for momentum indicators.
Price Action:
After tagging the top of the rising wedge, META is showing signs of weakness with a bearish candle and declining volume. Price closed at $715.81 (-1.58%), sitting just above a key support zone.
Support & Resistance:
Resistance: $726 (BB top), $740 (horizontal supply), $772.91 (upper BB 53 band)
Support: $714 (minor), $682–683 (strong horizontal + prior resistance turned support), $637 (EMA 100)
Indicators:
MACD: Still bullish but flattening, signaling slowing momentum.
RSI: 62.21 – cooling from overbought territory.
Volume: Lower on recent candles, suggesting reduced buyer strength.
Key Insight:
A pullback toward the $680 support zone would be healthy and could allow the RSI, MACD, and volume to reset from overextended levels. This would prepare META for a stronger continuation if demand steps back in.
Outlook:
META remains in a bullish structure, but short-term cooling is likely. A bounce from $682 or a breakout above $740 (with volume confirmation) could mark the next directional move. Keep an eye on the earnings date (July 28) for volatility.

Alphabet - The textbook break and retest!📧Alphabet ( NASDAQ:GOOGL ) will head much higher:
🔎Analysis summary:
If we look at the chart of Alphabet we can basically only see green lines. And despite the recent correction of about -30%, Alphabet remains in a very bullish market. Looking at the recent all time high break and retest, there is a chance that we will see new all time highs soon.
📝Levels to watch:
$200
🙏🏻#LONGTERMVISION
Philip - Swing Trader

AMD Stable Channel Up targets $168.Advanced Micro Devices (AMD) has been trading within a Channel Up since the April 08 market bottom. With the 4H MA50 (blue trend-line) as its Support since April 30, the pattern has shown incredible consistency, with the past two pull-backs almost touching the 0.382 Fibonacci retracement level.
As a result, given also the fact that the 4H RSI is supported by the Higher Lows trend-line, we view the current bounce as a solid buy opportunity for the short-term. We are targeting $168, which is the -0.5 Fibonacci extension, the level that the previous Higher High reached.
-------------------------------------------------------------------------------
** Please LIKE 👍, FOLLOW ✅, SHARE 🙌 and COMMENT ✍ if you enjoy this idea! Also share your ideas and charts in the comments section below! This is best way to keep it relevant, support us, keep the content here free and allow the idea to reach as many people as possible. **
-------------------------------------------------------------------------------
💸💸💸💸💸💸
👇 👇 👇 👇 👇 👇

Tesla - This bullish break and retest!Tesla - NASDAQ:TSLA - confirmed the bullish reversal:
(click chart above to see the in depth analysis👆🏻)
Tesla recently created a very bullish break and retest. Therefore together with the monthly bullish price action, the recent rally was totally expected. But despite the short term volatility, Tesla remains bullish, is heading higher and will soon create new highs.
Levels to watch: $400
Keep your long term vision!
Philip (BasicTrading)

Swing Pick +92% in 2 days $1.06 to $2.04Buy message on Friday before market close at $1.06 reaching $2.04 just 2 days later for +92% upside.
Trade had tight stop loss at $0.90 while going for at least +50% gain
NASDAQ:VOR
Big fat cup & handle on the weekly My instinct tells me today was the last dip buying opportunity before parabolic move. The daily chart is showing wedge consolidation and big institutions are buying. Elon just needs to focus
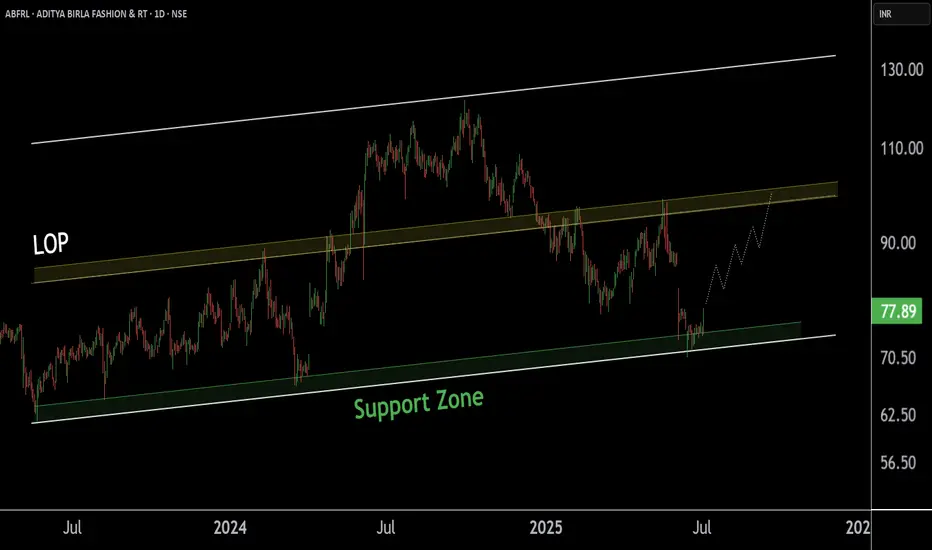
ABFRL at Best Support !!This is daily chart of ABFRL.
ABFRL having a good support zone near at 70.
ABFRL's last observed point (LOP) is near ₹100, which may now act as a resistance level.
ThanK You !!
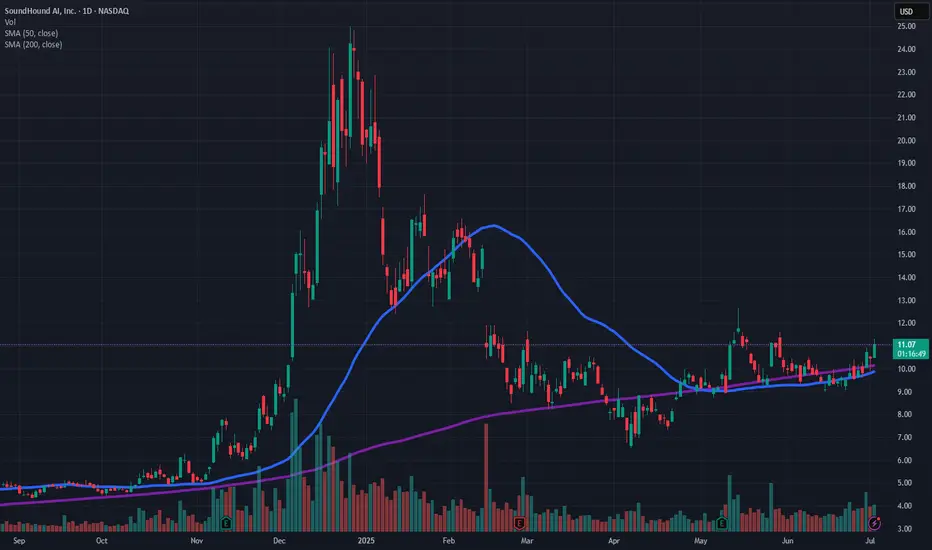
SoundHound AI Inc (SOUN) Looks BullishShort‑Term & Mid‑Term Outlook
Near-term : Watch for a breakout above ~$11.30 on above-average volume. If that occurs, expect a swift move toward $13–14.
Mid-term : If momentum holds, the stock could reach $16–18 over the next 4–8 weeks.
Alternative (bearish) : A breakdown below the lower flag trendline (~$10
and the 50‑day MA (~
$10.05) could trigger a pullback toward the $9–10 region.
What to Do Now
Watch for breakout at ~$11.30–11.40. A clean break on strong volume could signal a run.
Conservative spec entry on breakout, with stops under ~$10.00.
Target: $17.80 measured move; $16 for more disciplined play.
$OSCR long PT: $30-60 range- Undervalued Healthtech company growing revenue double digits.
- PEG < 1

7/2/25 - $corz - Have we forgotten...?7/2/25 :: VROCKSTAR :: NASDAQ:CORZ
Have we forgotten...?
- there's a possible deal happening here
- btc is ripping and so your downside beta is probably somewhat stagnant from the deal bid
- and then you just have natural rip on all energy/ hpc-btc complex stuff beta ripping
- nevermind the actual announcement potential
- bankers like to not work in july and especially august
- so *if* there is a deal here, my guess is it's probably communicated one way or the other sooner v later
- how quickly the market is ready to bid other chitco miners and not the one w/ the most tangible deal potential in the ST
but you do you. keep buying qubt and sym... enjoy
i'll stick to the high signal, better r/r on s/t like this
and for the degen stuff... well i've written about a few others today that are interesting setups far superior to the softbank and retail memes i denote above in this para.
check out $btcs... lmk what u think
but in the meanwhile. i still like this bitcoin beta w/ a deal backstop
V

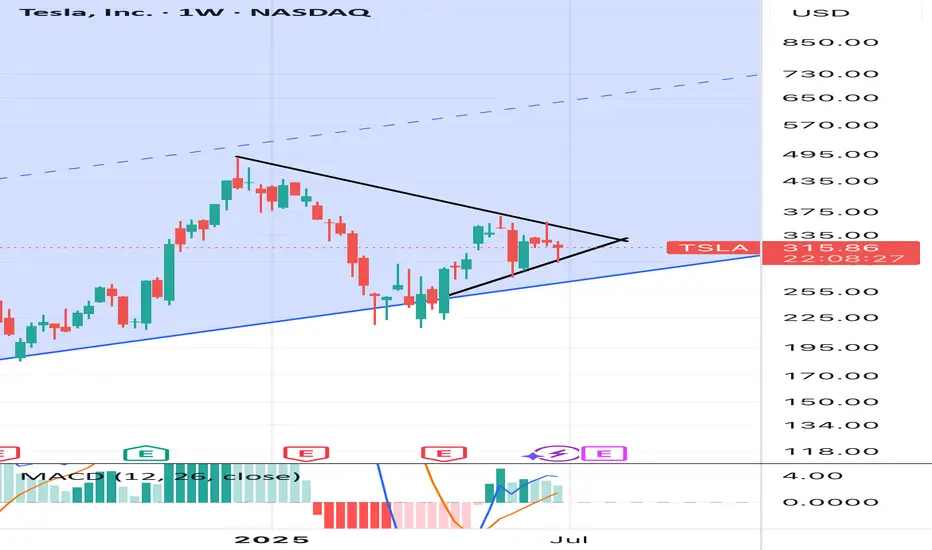
Tesla Bullish Breakout Setup: Entry at $295.54 Targeting $488.87Entry Point (Buy Zone): Around $295.54
Stop Loss: Between $272.94 – $295.54 (lower purple support zone)
Target (TP): $488.87
Current Price: $315.33 (as of the latest candle)
📈 Strategy Summary:
Setup Type: Long (Buy)
Risk-Reward Setup:
Reward: ~$193.33 per share (from $295.54 to $488.87)
Risk: ~$22.60 per share (from $295.54 to $272.94)
Reward:Risk Ratio ≈ 8.6:1 — a high potential payoff if the trade works out.
📊 Technical Context:
Support Zone: Price recently bounced off the support region (marked in purple).
Moving Averages:
Red Line (Short-Term MA): Price just crossed back above.
Blue Line (Long-Term MA): Price reclaimed this level — bullish signal.
Price Action: After a corrective phase, a possible reversal is forming at support, confirming bullish interest.
✅ Bullish Signals:
Bounce from support zone with a strong bullish candle.
Price closing above the 200-day MA (bullish trend resumption).
High reward-to-risk trade setup with clear stop loss.
⚠️ Considerations:
Confirmation with volume or a second bullish candle would add confidence.
Watch for earnings or macro events that could disrupt the trend.
Tight stop is essential to avoid drawdowns if the setup fails.
🔚 Conclusion
This is a well-structured long setup with a high potential reward. If price maintains above the entry zone and breaks recent highs, a push toward the $488.87 target is plausible.

Citigroup Wave Analysis – 2 July 2025
- Citigroup broke key resistance level 85.00
- Likely to rise to resistance level 90.00
Citigroup recently broke above the key resistance level 85.00 (former multi-month high from February, which stopped the previous wave (A), as can be seen below).
The breakout of the resistance level 85.00 accelerated the active minor impulse wave 5 of the intermediate impulse wave (C) from April.
Citigroup can be expected to rise further to the next resistance level 90.00 (intersecting with the daily up channel from April).

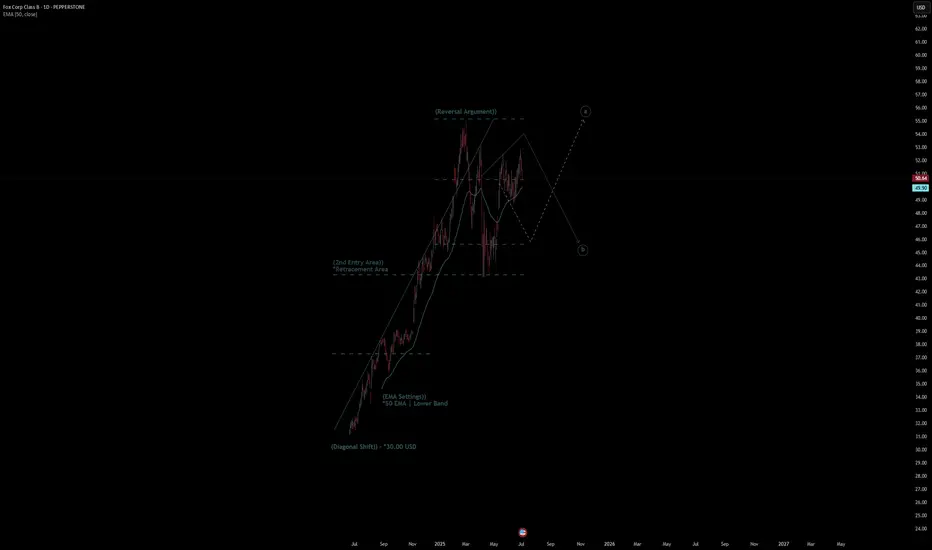
Fox Corp Class B Quote | Chart & Forecast SummaryKey Indicators On Trade Set Up In General
1. Push Set Up
2. Range Set Up
3. Break & Retest Set Up
Notes On Session
# Fox Corp Class B Quote
- Double Formation
* (Diagonal Shift)) - *30.00 USD | Completed Survey
* (2nd Entry Area)) | Subdivision 1
- Triple Formation
* (P1)) / (P2)) & (P3)) | Subdivision 2
* (TP1) = a / Long Consecutive Range
* (TP2) = b / Short Consecutive Pullback | Subdivision 3
* Daily Time Frame | Trend Settings Condition
- (Hypothesis On Entry Bias)) | Regular Settings
- Position On A 1.5RR
* Stop Loss At 45.00 USD
* Entry At 50.00 USD
* Take Profit At 58.00 USD
* (Uptrend Argument)) & No Pattern Confirmation
* Ongoing Entry & (Neutral Area))
Active Sessions On Relevant Range & Elemented Probabilities;
European-Session(Upwards) - East Coast-Session(Downwards) - Asian-Session(Ranging)
Conclusion | Trade Plan Execution & Risk Management On Demand;
Overall Consensus | Buy
7/2/25 - $btcs - Given sbet and bmnr... this?7/2/25 :: VROCKSTAR :: NASDAQ:BTCS
Given sbet and bmnr... this?
- 14,600 eth = 35 mm usd? and mkt cap is like 50... so that's another 1.5 mnav
- it's even smaller, no options... and we see what low float stuff does lately
- add to this the "comps" (quotes b/c this one is substantially smaller) like sbet and bmnr have run (and continue to run today)
- nevermind this has an actual software biz associated w it (and hold your nose if analyst recommendation for growth are adequate for revenue)... but there's something else here
- and their metamask "partnership" whatever that means.
i think this one could run substantially if sbet and bmnr keep up the whacky action (fortunately we're doing well on sbet at the moment)
V

MAZAGON DOCK SHIPBULL looking strong 2 hrs ( short to medium tLOOKING stable and strong bullish contracting triangle
pattern suggest us abv 3284 closing
price action may show some strength
These classic patterns sometime shows sparkle in price action
pattern may be wrong
do your analysis
this is for educational purpose

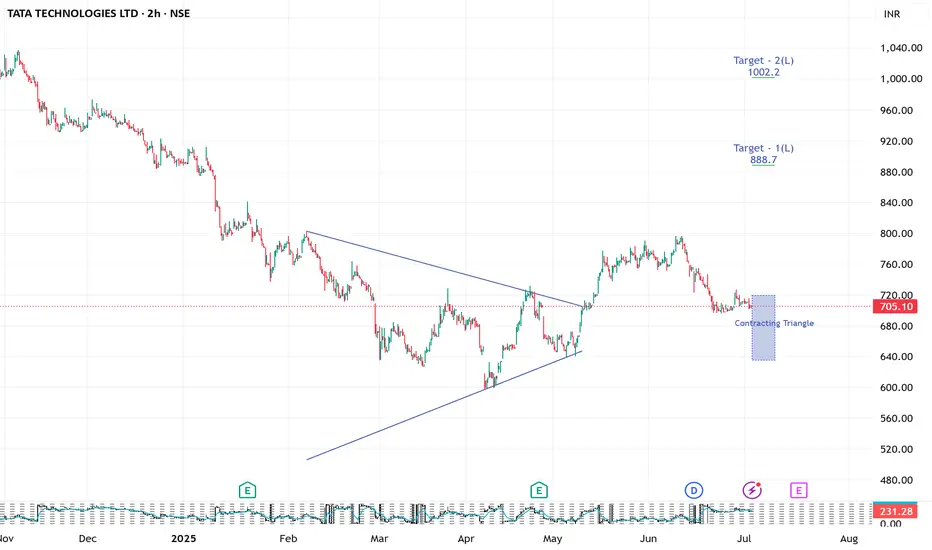
TATA TECHNOLGIES looking strong 2 hrs ( short to medium term
LOOKING stable and strong bullish contracting triangle
pattern suggest us abv 722 closing
price action may show some strength
These classic patterns sometime shows sparkle in price action
pattern may be wrong
do your analysis
this is for educational purpose
NOKIA!!!! Is it Diamond Again? OR? I am in the GAME. I will be waiting 3-10 years. if needed.)))
Jackpot, or I loose my LONG. It's ok. Risk , 3-5% from deposit.

GOOG LongMarket Structure Breakdown
Initial Break of Structure (BOS) – Bearish Phase
A significant bearish BOS occurred after a liquidity sweep above the prior high. This marked the temporary dominance of sellers, driving price downward.
Change of Character (ChoCh) – Sentiment Shift
Following the bearish leg, price printed a sharp recovery and broke above internal lower highs, signaling a Change of Character. This is the first indication of buyers regaining control.
Bullish BOS – Confirmation of Uptrend
The bullish BOS validated the upward structural transition, establishing new higher highs and higher lows. This confirms that institutional order flow has shifted bullishly.
🔹 Liquidity Dynamics
The liquidity sweep at the recent low (marked with a red dot) is a critical manipulation event, removing weak longs before institutions accumulate.
The current price action is printing a re-accumulation range, where price is likely to dip into key zones to trap breakout sellers.
Multiple liquidity pockets (green shaded regions) below serve as potential inducement zones. These areas may be revisited to gather liquidity before the next leg higher.
Final target is projected near the higher time frame sell zone around the $186–188 level, where substantial resting liquidity likely exists from previous swing highs.
🔹 Risk Management Considerations
Entry Zones: Look for confirmation-based entries within the liquidity trap zones, avoiding premature positioning at highs.
Stop-Loss: Place invalidation levels below engineered sweep zones to prevent getting caught in liquidity grabs.
Scaling Strategy: A tiered entry model can be effective here — initiating partial entries at the first trap and scaling in on deeper retracements.
Targeting: Conservative traders can aim for the internal high; aggressive positioning could seek full mitigation of the higher time frame zone.

Booking Holdings,,, buy opportunity Uptrend
As you see in the chart, the previous high has been broken and it could be a small pullback to broken price level. The presence of Doji candles indicates a suitable correction. Find a good trigger for entry to buying position based on your strategy. I suppose nest target could be around 6300 and set up a sure SL for your position.

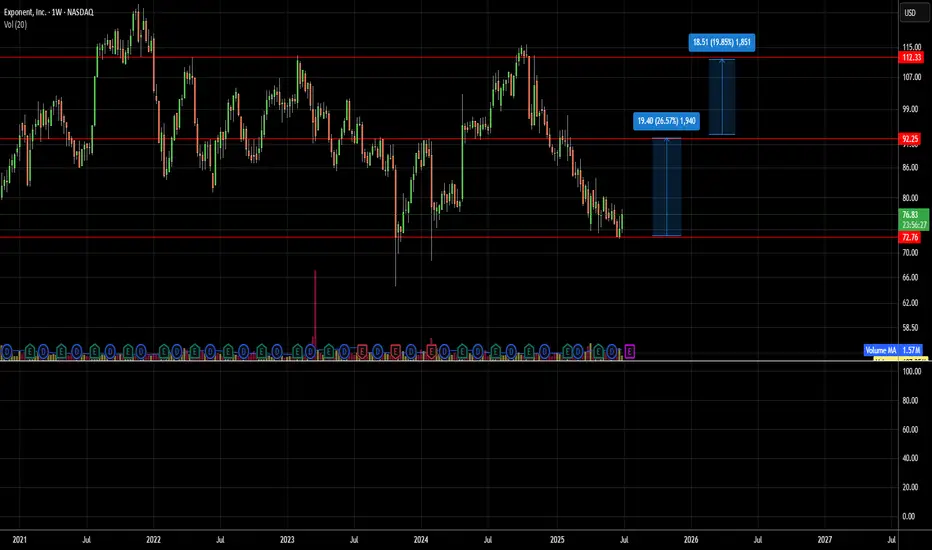
Expo near it's long term supportExponent, Inc. is a science and engineering consulting firm serving a diverse range of industries—including consumer products, energy, life sciences, environment, and health—with nearly 90 technical disciplines
Strengths
Robust financial health and profitability
High ROE and stable dividend payments
Risks
Modest growth vs peers
High payout ratio limits reinvestment
Recent insider selling could raise eyebrows
Valuation
Price/earnings slightly below historical norms
Significant upside potential per analysts (26–60%)