OPEN-SOURCE SCRIPT
Papercuts Price Distance Travelled
Updated
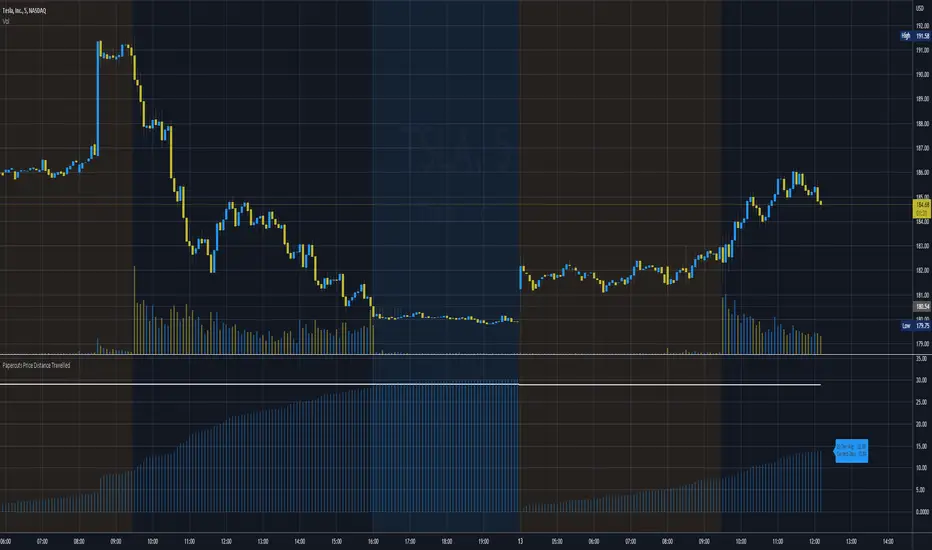
Papercuts Price Distance Travelled
aka
Maximum Per-Share Profit Potential
For: Intraday swing and scalp Traders.
This is a simple idea i wanted to explore where you could visualize the data of how much a price actually moves during the day.
Measuring through Daily ATR is helpful, but it only measures OHLC of the day, and way more tradeable movement happens than that.
So this measures movement a different way to increase perspective and awareness of price action.
Its like taking a pleated filter and unpleating it, which reveals a way longer structure.
It does this by aggregating the path of travel of an RSVAEMA (Relative Strength Volume Adjusted EMA) and returns the absolute value of its results.
Then it resets this daily, and returns the peak into an array that gets averaged.
This is helpful for seeing how normal or abnormal a days move might actually be. Many days feel extreme, but they are not, and vice versa.
This can be utilized to see how much movement actually happens at different levels. TSLA on 5m is an average daily movement of around 20$, but TSLA 15sec chart shows an average movement of around 100$. Pretty insane.
Release Notes
Updated: Preview Image-joel
Open-source script
In true TradingView spirit, the author of this script has published it open-source, so traders can understand and verify it. Cheers to the author! You may use it for free, but reuse of this code in publication is governed by House rules. You can favorite it to use it on a chart.
Disclaimer
The information and publications are not meant to be, and do not constitute, financial, investment, trading, or other types of advice or recommendations supplied or endorsed by TradingView. Read more in the Terms of Use.