OPEN-SOURCE SCRIPT
Developing Range v1.0

Developing Range v1.0
----------------------------
Azimuth Dynamics
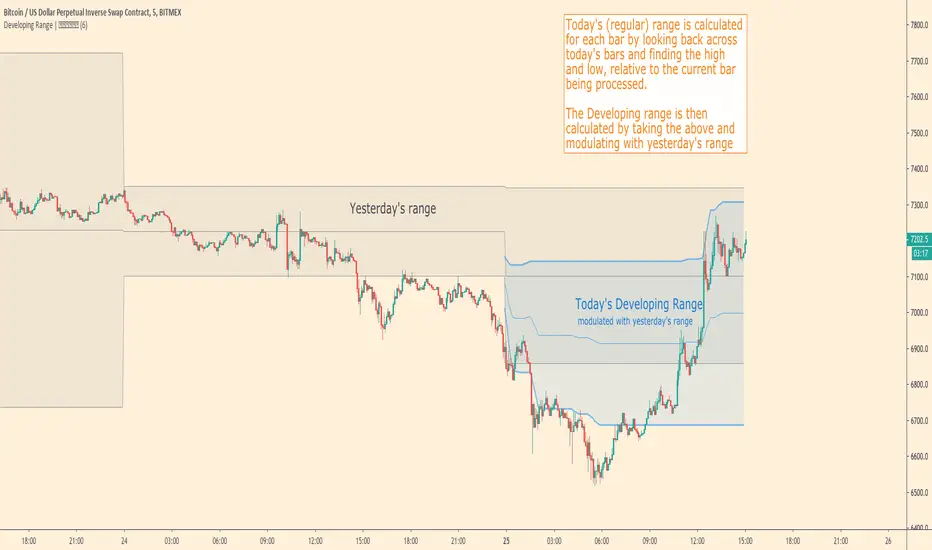
Scalping tool for help finding potentially high probability reactive levels. I suggest using on a 5min chart.
GRAY BAND: yesterday's High-Low range
BLUE BAND: today's Developing Range. Mean of today's High-Low range so far and yesterday's High-Low range, this is calculated for each of today's bars
THIN BLUE LINE: the mean of today's range median and yesterday's range median.
Note: we do not use the DAILY bar via 'security()' to obtain today's high and low. This would essentially be forward looking, instead we use iteration to check from the current bar back to midnight, bar by bar. This then allows a developing range to be established as the day prints new highs and lows.
Inspired by volatility trading textbook.
Open-source script
In true TradingView spirit, the author of this script has published it open-source, so traders can understand and verify it. Cheers to the author! You may use it for free, but reuse of this code in publication is governed by House rules. You can favorite it to use it on a chart.
Disclaimer
The information and publications are not meant to be, and do not constitute, financial, investment, trading, or other types of advice or recommendations supplied or endorsed by TradingView. Read more in the Terms of Use.