OPEN-SOURCE SCRIPT
Updated Rainbow Histogram v1.01
Sure! Here’s a compelling English version of the article for your TradingView post:
---
### 🌈 **Introducing Rainbow Histogram: A Fusion of EMA and MA for Enhanced Trading Analysis**
**Hello Traders,**
I’m excited to introduce a fresh concept that combines technical analysis techniques into a new indicator called **Rainbow Histogram**. This innovative tool blends Exponential Moving Averages (EMA) and Moving Averages (MA) to provide you with a powerful and accurate tool for making trading decisions.
#### **🎨 What is Rainbow Histogram?**
The Rainbow Histogram is designed to help you identify market trends and signal precise entry and exit points by blending EMA and MA into a colorful "Rainbow" display. This visual approach enhances your ability to spot trend strength and direction with clarity.
#### **📈 How Does Rainbow Histogram Work?**
1. **Exponential Moving Average (EMA):** Captures short-term trends and reacts quickly to price changes.
2. **Moving Average (MA):** Tracks long-term trends and provides a broader view of the market direction.
**Rainbow Histogram** uses the combination of EMA and MA to create a histogram that shows the difference between these two averages in distinct colors. This makes it easy to visualize trend changes and market momentum.
#### **🔧 Setting It Up**
1. **EMA:** Adjust the EMA settings based on your trading timeframe and strategy (e.g., EMA 9, EMA 21).
2. **MA:** Set the MA parameters to capture long-term trends (e.g., MA 50, MA 200).
#### **🌟 Why Use Rainbow Histogram?**
- **Simplified Analysis:** Quickly identify trends and their strength with a clear visual representation.
- **Distinct Colors:** Differentiate between EMA and MA with vibrant colors for easy interpretation.
- **Precise Signals:** Get clear buy and sell signals based on histogram changes.
#### **📥 Get Started**
Add **Rainbow Histogram** to your TradingView charts by searching for the script in TradingView’s library or set it up manually using the recommended settings.
#### **📝 In Summary**
**Rainbow Histogram** is a unique tool that simplifies trend analysis and enhances accuracy by merging EMA and MA into a single, colorful indicator. Use this tool to refine your trading strategy and make more informed financial decisions.
If you have any questions or feedback about **Rainbow Histogram**, feel free to comment below or send me a message!
**Happy Trading!** 🌟
---
I hope this version effectively captures attention and engages your audience!
---
### 🌈 **Introducing Rainbow Histogram: A Fusion of EMA and MA for Enhanced Trading Analysis**
**Hello Traders,**
I’m excited to introduce a fresh concept that combines technical analysis techniques into a new indicator called **Rainbow Histogram**. This innovative tool blends Exponential Moving Averages (EMA) and Moving Averages (MA) to provide you with a powerful and accurate tool for making trading decisions.
#### **🎨 What is Rainbow Histogram?**
The Rainbow Histogram is designed to help you identify market trends and signal precise entry and exit points by blending EMA and MA into a colorful "Rainbow" display. This visual approach enhances your ability to spot trend strength and direction with clarity.
#### **📈 How Does Rainbow Histogram Work?**
1. **Exponential Moving Average (EMA):** Captures short-term trends and reacts quickly to price changes.
2. **Moving Average (MA):** Tracks long-term trends and provides a broader view of the market direction.
**Rainbow Histogram** uses the combination of EMA and MA to create a histogram that shows the difference between these two averages in distinct colors. This makes it easy to visualize trend changes and market momentum.
#### **🔧 Setting It Up**
1. **EMA:** Adjust the EMA settings based on your trading timeframe and strategy (e.g., EMA 9, EMA 21).
2. **MA:** Set the MA parameters to capture long-term trends (e.g., MA 50, MA 200).
#### **🌟 Why Use Rainbow Histogram?**
- **Simplified Analysis:** Quickly identify trends and their strength with a clear visual representation.
- **Distinct Colors:** Differentiate between EMA and MA with vibrant colors for easy interpretation.
- **Precise Signals:** Get clear buy and sell signals based on histogram changes.
#### **📥 Get Started**
Add **Rainbow Histogram** to your TradingView charts by searching for the script in TradingView’s library or set it up manually using the recommended settings.
#### **📝 In Summary**
**Rainbow Histogram** is a unique tool that simplifies trend analysis and enhances accuracy by merging EMA and MA into a single, colorful indicator. Use this tool to refine your trading strategy and make more informed financial decisions.
If you have any questions or feedback about **Rainbow Histogram**, feel free to comment below or send me a message!
**Happy Trading!** 🌟
---
I hope this version effectively captures attention and engages your audience!
Release Notes
### **Rainbow Histogram v1.01****Overview:**
**Rainbow Histogram v1.01** is a powerful trading tool designed to help traders identify and follow market trends using a combination of moving averages and technical indicators. This indicator minimizes false signals in low-volatility markets and provides clear buy and sell signals, allowing traders to make better, more informed decisions.
**Key Features:**
1. **EMA (Exponential Moving Averages):** This indicator uses multiple EMAs (21, 55, 100, 200, 300, 400) to highlight both short-term and long-term price trends. These EMAs are displayed as histograms in different colors to visually represent the trend strength.
2. **MA (Simple Moving Averages):** Several MAs (7, 11, 23, 25, 39, 200) are used to confirm short-term price movements. The MA 200 line is shown clearly in white to represent long-term market direction.
NEW 3. **RSI (Relative Strength Index):** RSI is included as a filter to avoid overbought (RSI > 70) or oversold (RSI < 30) conditions. This ensures that the buy/sell signals are triggered only when the market is in a favorable position.
NEW 4. **ATR (Average True Range):** ATR is used to filter out low-volatility markets and only triggers signals when the market shows enough movement, helping you avoid trading in choppy conditions.
UPDATE 5. **Buy/Sell Signals:** The system generates a buy signal when EMA 21 crosses above MA 7 and a sell signal when EMA 21 crosses below MA 7. These signals are further confirmed by RSI and ATR to reduce false entries.
6. **Easy to Use:** Buy signals (green markers) and sell signals (red markers) are clearly displayed on your chart, making it simple for traders to follow the trend and act accordingly.
**Settings:**
- **RSI:** Default set to 14, you can adjust this to fit your trading style.
- **ATR Threshold:** Set to 0.5 by default, you can modify it depending on the volatility of the asset you’re trading.
- **EMAs and MAs:** These are preset for optimal use across both short-term and long-term trends but can be adjusted to suit your strategy.
**How to Use:**
1. Add **Rainbow Histogram v1.01** to your chart.
2. Use the default settings or customize the RSI and ATR filters to match the asset you’re trading.
3. Follow the buy and sell signals as they appear on the chart, and observe how the EMA and MA lines interact to confirm trend direction.
**Who Should Use This:**
Whether you’re a beginner or an experienced trader, **Rainbow Histogram v1.01** helps improve your strategy by providing reliable buy and sell signals, filtering out noise, and reducing the chances of false trades.
**Pro Tip:**
Before using this indicator in live trading, try backtesting it in TradingView to see how well it works with your chosen assets and strategies.
**Important Note:**
While this indicator can help filter out false signals, it’s not foolproof. Always combine it with your own market analysis and risk management strategies.
---
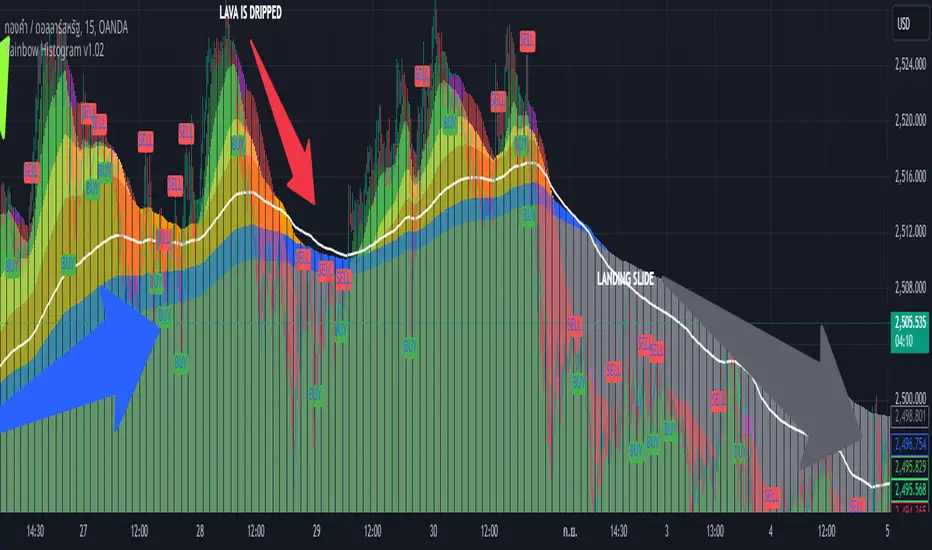
"Blue is like groundwater where the price is driven by price pressure. When the blue stream ends, it may signal a potential reversal, leading to a gray zone resembling a landslide where the price continuously drops. When a green zone appears, the price may surge upward due to buying pressure, symbolizing trees sprouting on a mountain. If you see multiple green zones, it indicates an upward trend without a doubt. However, occasionally there might be a price collapse, prompting you to stay vigilant. Buy and sell signals are merely indicated by the crossover of lines, so it is also essential to consider other factors."
----
This version highlights the key features of the indicator in a way that is easy to understand, making it appealing to both novice and experienced traders alike.
Open-source script
In true TradingView spirit, the creator of this script has made it open-source, so that traders can review and verify its functionality. Kudos to the author! While you can use it for free, remember that republishing the code is subject to our House Rules.
Disclaimer
The information and publications are not meant to be, and do not constitute, financial, investment, trading, or other types of advice or recommendations supplied or endorsed by TradingView. Read more in the Terms of Use.