PROTECTED SOURCE SCRIPT
Fractal Fire Zones/Wave Rider
Updated

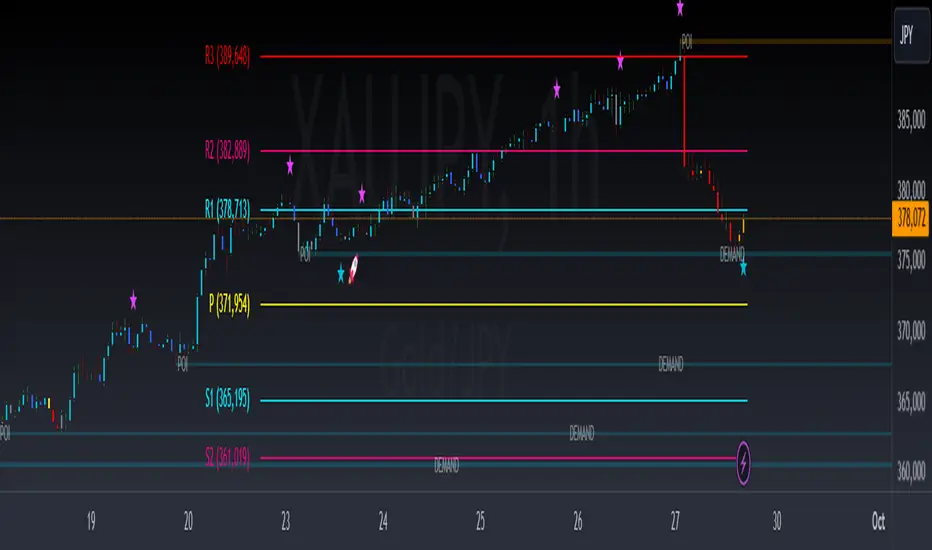
Multi timeframe confluence reader: This indicator plots fractals on any specific timeframe selected, multi time frame ema cross that changes color with the trend, multi timeframe 200ema and a calculation that shows potential turning points with a multi timeframe stochastic oscillator confluence. The fire zones are preferred in a ranging market or for potential scalps while the ema trend is designed to keep you with the main trend in any given session. The accumulation/distribution candles can be used to gauge pull backs for re entry or exits based on time or multiple confirmations.
Release Notes
Pivots are suggested to use with this indicator for high confluence set ups. Here's a stud of Aud futures :
-Added visual brightness.
-Added a duplicate script for anyone that wants to analyze more than one timeframe at a time.
-Put the default fractal timeframes to 8H and Daily to only show more important levels and reduce chart noise.
-Labeled the characters by 1H and 4H signals. Default stoch settings cater to best inputs, characters are customizable(emojis are welcome) 1H signals are pink and blue while 4H signals are red and green by default.
-Signals are made for that specific timeframe and may appear different in higher/lower timeframes but the 1H scalp signals match fine if you're using a 15m timeframe.
tradingview.com/x/SQ1xqXvHhttps://www.tradingview.com/x/Nf1HR655/https://www.tradingview.com/x/7xRtmvsm/https://www.tradingview.com/x/Ju5o7v54/https://www.tradingview.com/x/BtQ37fHE/https://www.tradingview.com/x/s8W65qz6/[image}
Release Notes
User input easier to understandRelease Notes
interface Release Notes
Added a Macd filterRelease Notes
User interface Release Notes
Chart LayoutRelease Notes
Get in the Zone:New ability to see candles based on their structure of previous price action, 2 stage strength/weakness and consolidation color ratings.
**For best visual effects go to Settings<Symbol< & Uncheck Borders
Release Notes
Major Update V2 to V5:______________________________________________
- [Fixed the Fire Zones so they only appear on the specified timeframes
Added Fibonacci Pivot Points( Most accurate with regular Candlesticks)
Added Sessions & Kill Zones ( Asia Kill, Ny Kill(Us Open),London Close, Power Hours
Removed fractals & Fast Ema crosses by default(can apply ema cross through settings)
2 Timeframe 200emas(Customizable)
Rejection Blocks(Preferred with Heiken Ashi on the 5m & 15m timeframes)(They will appear as purple rectangles above or under price depending on the direction.
*Kill zones will appear as multi color range boxes ]
Release Notes
Minor tweaks/Fixed errorsRelease Notes
-Removed ema trend as default , still usable in settings(200 Emas by default)-Removed fractals
*Added Fibonacci Pivots
*Fire zones now show on specified timeframes and clean on higher time frames than 4H
*Added rejection blocks(3/15m Heiken Ashi is good, regular candles are solid also) can be used as a potential entry on the next candle after they appear[Purple blocks].
*Added Session times and kill zones (Asia Kill, Cover hour, NY Kill, London Close Kill, Power Hours.(15m & lower timeframes)
Release Notes
Daylight Savings -1Release Notes
-Updated pivots from a 13 look back period to just showing the current levels for the day to clean up the chart-Added Bank Zones(Beta): It's now possible to identify all previous session High/Lows of the London session(blue) & New York Session(Grey) being shown as default, Asia session is a optional setting since most of the time you can use the range of the Asia Kill Zone instead. Good to use as a confluence factor. 30 minute chart is preferred for these zones but is subjective.
-Decreased the Rejection Block look back period so it only shows the last 2 to further clean up the chart by default
Release Notes
Chart Update**Release Notes
*Release Notes
*+Release Notes
-Made a few a few adjustments to settings tab to make it easier to show/hide some indicators-Added Fractals
-Added Bollinger Bands
-Changed the color of the London Bank zones to a darker shade
*You are able to use a multitude of different indicators at one time without taking up your indicator slots. At the same time can customize the indicators & Show/Hide the ones you want
Release Notes
-Cleaner default chartRelease Notes
Changed default 200 emas to 15m & 4hRelease Notes
New York bank zones only show by default, Asia & London zones still accessible through settingsRelease Notes
__Release Notes
Fractals visible on Mobile nowRelease Notes
Grammar error corrected in settings for bank zonesRelease Notes
-Bank Zones now only visible on optimal timeframes(30M and below) to reduce clutter on higher timeframes since it measures the zone from the bodies-wicks.-Changed the opacity of Bank Zones to a lighter color by default
-Replaced Asia Bank Zone with Overnight Open Price(search YT : Robert Anderson for strategies)
-Made all Bank Zones visible by default(search YT : WealthFRX for strategies)
-Moved Bank Zone setting higher in the settings for better accessibility
**Here are a few examples of opportunities that could have been taken in a Week 3/Day 3 parabolic template leading into a NASDAQ:FREE Cash Friday. This template is important due to major Monthly options expiring on the 3rd Saturday of each month**
Release Notes
Chart updateRelease Notes
Crypto chartRelease Notes
Correction**Release Notes
DayLight Savings AdjustmentRelease Notes
Overnight Open DayLight SavingsRelease Notes
Added automatic supply/demand zonesRelease Notes
-Cleaned up with supply/demand zones by removing the borders and lightening the word opacity.-Corrected the bank zones for London to encapsulate the 2am( EST and 8am EST high/lows & New York the 8am EST crossover and 5pm EST daily close high/low zones
Release Notes
Chart UpdateDisclaimer
The information and publications are not meant to be, and do not constitute, financial, investment, trading, or other types of advice or recommendations supplied or endorsed by TradingView. Read more in the Terms of Use.