OPEN-SOURCE SCRIPT
Volume on levels @gauranshg
Updated

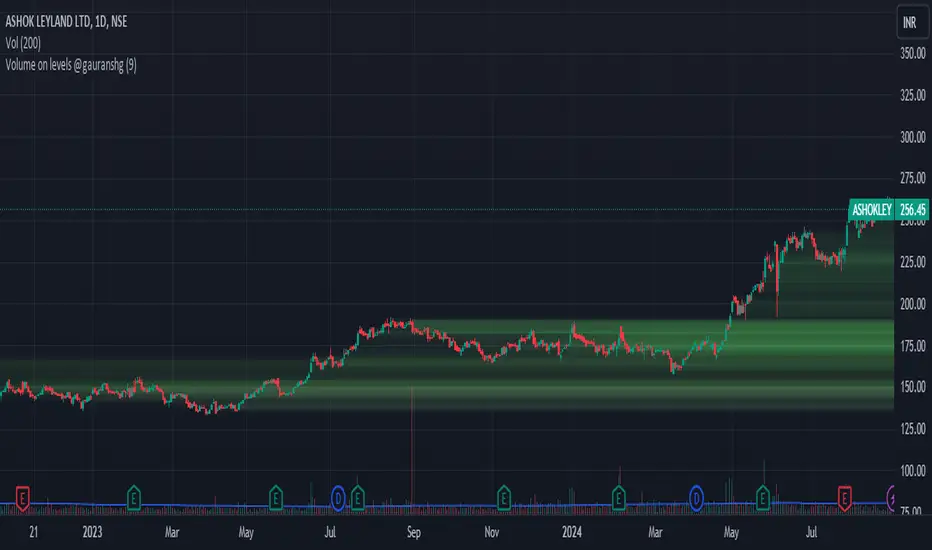
Volume on Levels gauranshg is a powerful Pine Script designed to visualize trading volume across price levels directly on the chart. This script allows users to observe volume intensity, offering a clearer perspective on price action and potential support/resistance areas. By utilizing a dynamic, customizable multiplier, the volume is normalized and displayed in proportion, ensuring better scalability across various timeframes and assets.
Usage:
Normalization of Volume: Users can input a multiplier to adjust the normalization of volume. This is useful when analyzing assets with differing price and volume ranges.
Input of 1 means 1 Million volume will be marked with green color of opacity 1 and 2 Million as 2 and so on. In case you are looking at chart with very high volume, you might want to increase the multiplies
Default multiplier is set to 1, and can be customized for different scales.
Volume Visualization: The volume is displayed on the chart as background boxes behind price levels, with the opacity of the boxes changing based on the normalized volume. This helps to quickly visualize areas of high and low trading activity.
This script is ideal for investors who wish to enhance their volume analysis by visualizing it directly on price levels in a clear, normalized format.
Release Notes
Volume on Levels gauranshg is a powerful Pine Script designed to visualize trading volume across price levels directly on the chart. This script allows users to observe volume intensity, offering a clearer perspective on price action and potential support/resistance areas. By utilizing a dynamic, customizable multiplier, the volume is normalized and displayed in proportion, ensuring better scalability across various timeframes and assets.Usage:
Normalization of Volume: Users can input a multiplier to adjust the normalization of volume. This is useful when analyzing assets with differing price and volume ranges.
Input of 1 means 1 Million volume will be marked with green color of opacity 1 and 2 Million as 2 and so on. In case you are looking at chart with very high volume, you might want to increase the multiplies
Default multiplier is set to 1, and can be customized for different scales.
Volume Visualization: The volume is displayed on the chart as background boxes behind price levels, with the opacity of the boxes changing based on the normalized volume. This helps to quickly visualize areas of high and low trading activity.
This script is ideal for investors who wish to enhance their volume analysis by visualizing it directly on price levels in a clear, normalized format.
Open-source script
In true TradingView spirit, the author of this script has published it open-source, so traders can understand and verify it. Cheers to the author! You may use it for free, but reuse of this code in publication is governed by House rules. You can favorite it to use it on a chart.
Disclaimer
The information and publications are not meant to be, and do not constitute, financial, investment, trading, or other types of advice or recommendations supplied or endorsed by TradingView. Read more in the Terms of Use.