OPEN-SOURCE SCRIPT
Mancini Levels
Updated

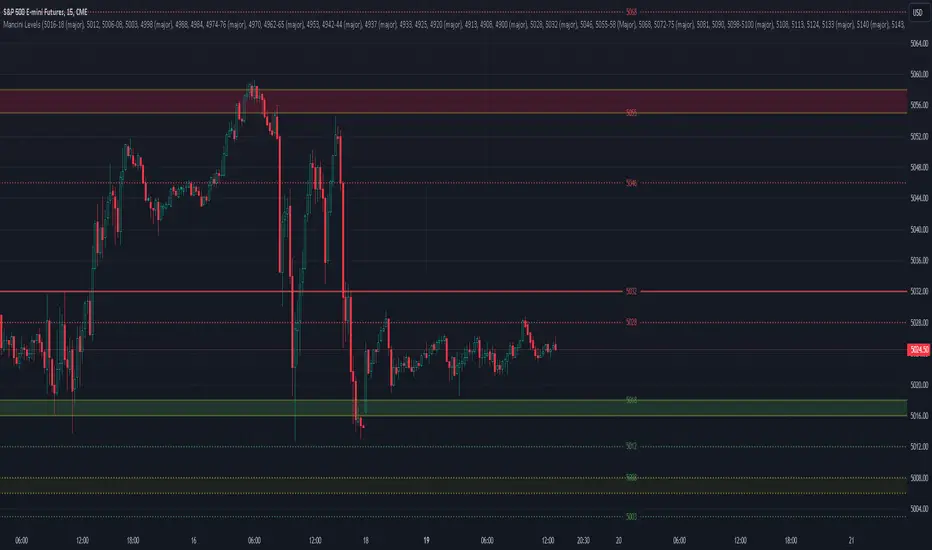
Another level parsing indicator.
Add your list of support and resistance levels as inputs in a comma-delimited list, including ranges e.g. <price>-<price>, with an optional (major) to signify a major level.
Format is <level> <(major)>"," <level> <(major)>,<...n> for both support and resistance, with optional "major" designation after each numeric level, comma-separated
Release Notes
Ranges now shaded differently for major ranges vs. notRelease Notes
tweak range colors:green: major support
olive: minor support
maroon: minor resistance
red: major resistance
Release Notes
Tuned Colors and transparencies:Major Resistance: Crimson (80)
Minor Resistance: Red (90)
Minor Support: Olive (90)
Major Support Green (80)
Release Notes
Update to fix "Error on bar 0: In 'array.get()' function. Index 0 is out of bounds, array size is 0" error. This happened when you provide input that doesn't have any ranges. I never saw it because I always enter input with ranges...made a quick fix to check that there are ranges before trying to draw them.Release Notes
Added an input for Line Width, increase to 2 or 3 to thicken up the levels if you prefer wider lines.Release Notes
*** Bugfix versionA huge THANK YOU to everyone who pointed out the issues with the previous versions, it really helped me in troubleshooting these issues
- Default maximum of lines for a script is 50. Bumped this up to 500 which is the most for a script. This explains why on days with extra supports (e.g. FOMC, CPI days, or days with over 50 S/Rs listed) some of the lines did not appear. I was not aware of this default which dropped lines.
- Only drawing lines on lastbar instead of over and over again with each bar.
- Account for uppercase 'Major' written sometimes too instead of the expected 'major'
Release Notes
All colors are configurable as inputs now. No other changes.Release Notes
Label Correction for Color InputsRelease Notes
This version fixes the 'darkening' of lines and ranges over time. The issue was happening because new lines were being added without old ones being pulled. This version adds lines and ranges and pulls the extra from the arrays bar over bar so that the right amount of lines/ranges are on the chart with each new bar, so there isn't a seeming change in transparency (which was just lines/ranges clobbering others).Release Notes
Updates:1. Can change line styles for major/minor. Default style for minor changed to dotted.
2. Added price labels. These can be disabled in settings but are enabled by default. Label offset (from last bar right) can be configured as well, defaults to 30. Range labels are only on bottom of range line for resistance, top of range line for support as sometimes ranges are pretty tight.
Release Notes
(just update chart)Open-source script
In true TradingView spirit, the author of this script has published it open-source, so traders can understand and verify it. Cheers to the author! You may use it for free, but reuse of this code in publication is governed by House rules. You can favorite it to use it on a chart.
Disclaimer
The information and publications are not meant to be, and do not constitute, financial, investment, trading, or other types of advice or recommendations supplied or endorsed by TradingView. Read more in the Terms of Use.