OPEN-SOURCE SCRIPT
OBV High / LOW (On-Balance Volume )
Updated
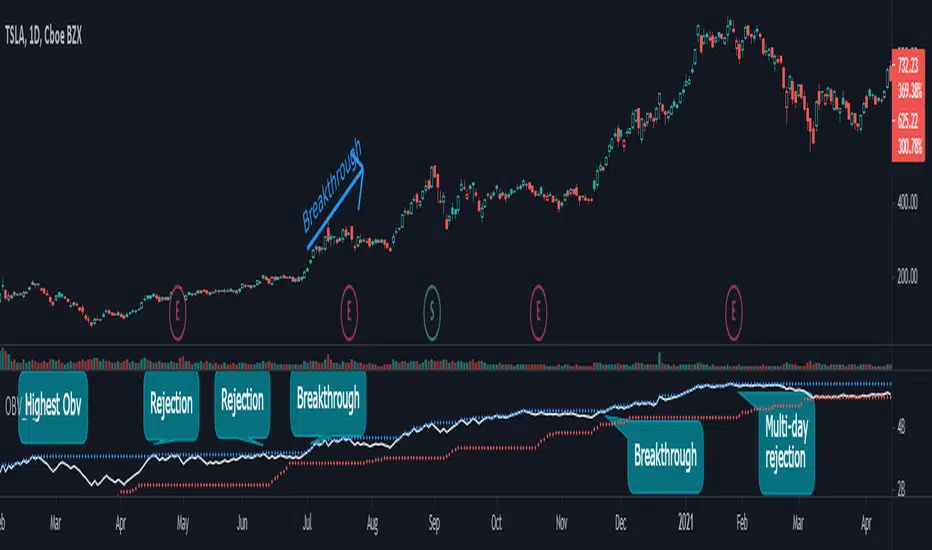
This is a simple application of OBV indicator (On-Balance Volume ), to visually determine when a given stock current obv is near the highest or lowest based on the number of lookback bars.
Indicator examples:
### OBV value is near an all-time high ##
Example

Inputs
Notes:
OBV information
https://www.investopedia.com/terms/o/onbalancevolume.asp
Comments:
This is my first script any ideas, suggestions, or detected errors (language/script) don´t hesitate to send a message.
Best regards, Mauro.
Indicator examples:
### OBV value is near an all-time high ##
- breakthrough, stock value could set new all-time highs.
- rejection, stock value could come down or consolidate.
Example
Inputs
- OBV High Lookback -> numbers of bars to look back for the obv high.
- OBV LowLookback -> numbers of bars to look back for the obv low.
- OBV EMA Length -> Ema length
Notes:
- This script also comes with an ema indicator based on obv for smoothing the obv signal since it gets noise at lower timeframes (by default comes disabled)
OBV information
https://www.investopedia.com/terms/o/onbalancevolume.asp
Comments:
This is my first script any ideas, suggestions, or detected errors (language/script) don´t hesitate to send a message.
Best regards, Mauro.
Release Notes
Minor fix : Change OBV plot color from white to yellow to fix white theme problemOpen-source script
In true TradingView spirit, the author of this script has published it open-source, so traders can understand and verify it. Cheers to the author! You may use it for free, but reuse of this code in publication is governed by House rules. You can favorite it to use it on a chart.
Disclaimer
The information and publications are not meant to be, and do not constitute, financial, investment, trading, or other types of advice or recommendations supplied or endorsed by TradingView. Read more in the Terms of Use.