PROTECTED SOURCE SCRIPT
Stocksgeeks MBI
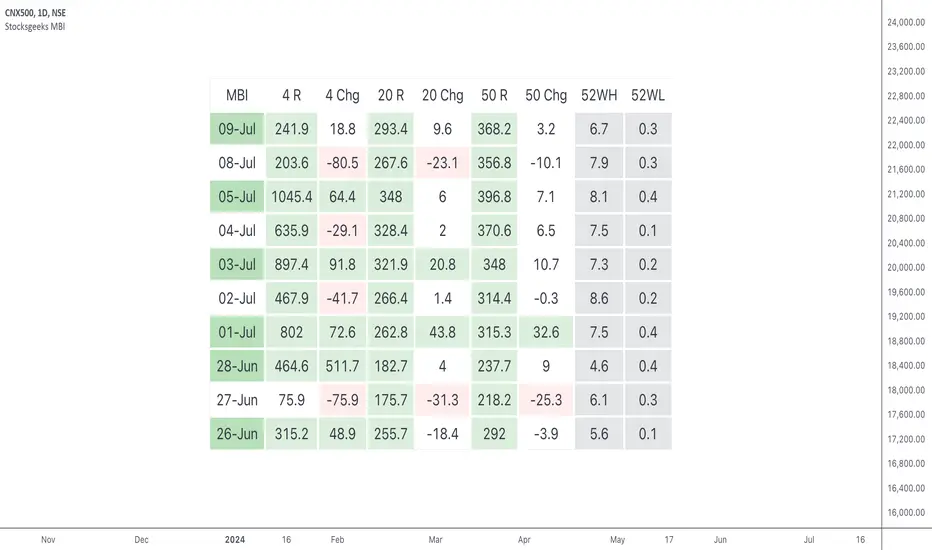
This indicator displays the Stocksgeeks market breadth dashboard for NSE (India) stocks.
Market breadth provides insights into the participation of stocks in a market's movement & the conviction in the overall mood of the underlying index. Various interpretations of market breadth exist, including gauging the quantity of new highs and new lows, or the number of advancing & declining stocks, or the percentage of stocks above or below certain moving averages.
This dashboard includes the following metrics:
4R
A count or ratio of advancing & declining stocks objectively depicts their participation in an index or stock universe. A positive market breadth is said to happen when more stocks are advancing than are declining.
The 4R column is based on 4% advances & declines.
The advances are calculated as the number of stocks having a daily percentage change ≥ 4% divided by the total number of stocks having a daily percentage change < -4%.
20R
When most of the stocks are trading above a specific moving average, the market breadth is termed strong. This dashboard uses 20-day EMA for short-term timeframes.
50R
For medium to long-term timeframes, this dashboard uses 50-day EMA.
52WH &52WL
These 2 columns display the net number of stocks on NSE (India) making new 52-week highs or new 52-week lows. A market is considered strong (bullish) when new highs exceed new lows.
Interpretation
The 52 week highs must be greater than 52 weeks lows for a bullish bias.
This is how the individual columns are coded:
To decide the overall color for the day, we subtract the number of red boxes from the number of green boxes for the day. If the output is greater than equal to 3, then the day color is green, and if this is less than equal to -3 then the day color is red. In case of no consensus, the overall day color is neutral.
The color of the 20R & 50R indicates the trend (green is uptrend, & red is downtend). The color of the 4R column & the chg columns (4 chg, 20 chg, 50 chg) indicates the strength of the trend.

Features
⦿ Expanded mode: This is the default state & displays the market breadth for the past 10 days.
⦿ Mini mode: This displays only the overall color for the day.
⦿ One-day mode: Turning off both the expanded & the mini mode displays the one-day mode, which displays the market breadth columns for the current day only.
⦿ Dark mode: One-click dark mode, as usual.
Dependency
The script uses the Pine Seeds service to import custom data hosted in a GitHub repository and accesses it via TradingView as the frontend. So, the number of bars appearing on charts is fully dependent on the amount of historical data available. Any error or omission, if there, is a reflection of the hosted data, & not that of Tradingview.
Limitations
Such data has some limitations, like it can only be updated at EOD (End-of-Day), & only daily-based timeframes can be applied to such data. Irrespective of the intraday changes, only the last saved value on the chart is seen. So, it's best to use this script as EOD, rather than intraday. At the time of publication of this script, 375 days of historical data was available.
Credits
The Stocksgeeks interpretation of the market breadth is from Umang, who has graciously allowed his concepts to be coded into a script for TradingView. This script uses the NSE Market Breadth data from Chhirag_Kedia via a pine seed from EquityCraze. Hats off to these amazing individuals, without whose efforts, such scripts wouldn't have seen the light of this day!
Market breadth provides insights into the participation of stocks in a market's movement & the conviction in the overall mood of the underlying index. Various interpretations of market breadth exist, including gauging the quantity of new highs and new lows, or the number of advancing & declining stocks, or the percentage of stocks above or below certain moving averages.
This dashboard includes the following metrics:
4R
A count or ratio of advancing & declining stocks objectively depicts their participation in an index or stock universe. A positive market breadth is said to happen when more stocks are advancing than are declining.
The 4R column is based on 4% advances & declines.
The advances are calculated as the number of stocks having a daily percentage change ≥ 4% divided by the total number of stocks having a daily percentage change < -4%.
- 4R is the ratio between NSE (India) stocks advancing or declining by 4% daily.
- 4 chg is the % change from yesterday’s 4R value to today’s 4R value.
20R
When most of the stocks are trading above a specific moving average, the market breadth is termed strong. This dashboard uses 20-day EMA for short-term timeframes.
- 20R is the ratio between the % of NSE (India) stocks above & below the 20-day moving average.
- 20 chg is the % change from yesterday’s 20R value to today’s 20R value.
50R
For medium to long-term timeframes, this dashboard uses 50-day EMA.
- 50R is the ratio between the % of NSE (India) stocks above & below the 50-day moving average.
- 50 chg is the % change from yesterday’s 50R value to today’s 50R value.
52WH &52WL
These 2 columns display the net number of stocks on NSE (India) making new 52-week highs or new 52-week lows. A market is considered strong (bullish) when new highs exceed new lows.
Interpretation
The 52 week highs must be greater than 52 weeks lows for a bullish bias.
This is how the individual columns are coded:
- 4R: above 200 is green, below 50 is red
- 20R: above 75 is green, below 50 is red
- 50R: above 85 is green, below 60 is red
- For all the changes (4 chg, 20 chg, 50 chg): above 20 is green and below -20 is red
To decide the overall color for the day, we subtract the number of red boxes from the number of green boxes for the day. If the output is greater than equal to 3, then the day color is green, and if this is less than equal to -3 then the day color is red. In case of no consensus, the overall day color is neutral.
The color of the 20R & 50R indicates the trend (green is uptrend, & red is downtend). The color of the 4R column & the chg columns (4 chg, 20 chg, 50 chg) indicates the strength of the trend.
Features
⦿ Expanded mode: This is the default state & displays the market breadth for the past 10 days.
⦿ Mini mode: This displays only the overall color for the day.
⦿ One-day mode: Turning off both the expanded & the mini mode displays the one-day mode, which displays the market breadth columns for the current day only.
⦿ Dark mode: One-click dark mode, as usual.
Dependency
The script uses the Pine Seeds service to import custom data hosted in a GitHub repository and accesses it via TradingView as the frontend. So, the number of bars appearing on charts is fully dependent on the amount of historical data available. Any error or omission, if there, is a reflection of the hosted data, & not that of Tradingview.
Limitations
Such data has some limitations, like it can only be updated at EOD (End-of-Day), & only daily-based timeframes can be applied to such data. Irrespective of the intraday changes, only the last saved value on the chart is seen. So, it's best to use this script as EOD, rather than intraday. At the time of publication of this script, 375 days of historical data was available.
Credits
The Stocksgeeks interpretation of the market breadth is from Umang, who has graciously allowed his concepts to be coded into a script for TradingView. This script uses the NSE Market Breadth data from Chhirag_Kedia via a pine seed from EquityCraze. Hats off to these amazing individuals, without whose efforts, such scripts wouldn't have seen the light of this day!
Disclaimer
The information and publications are not meant to be, and do not constitute, financial, investment, trading, or other types of advice or recommendations supplied or endorsed by TradingView. Read more in the Terms of Use.