OPEN-SOURCE SCRIPT
Multi-Timeframe EMA Distance & % Change Table
Description of Multi-Timeframe EMA Distance & % Change Table
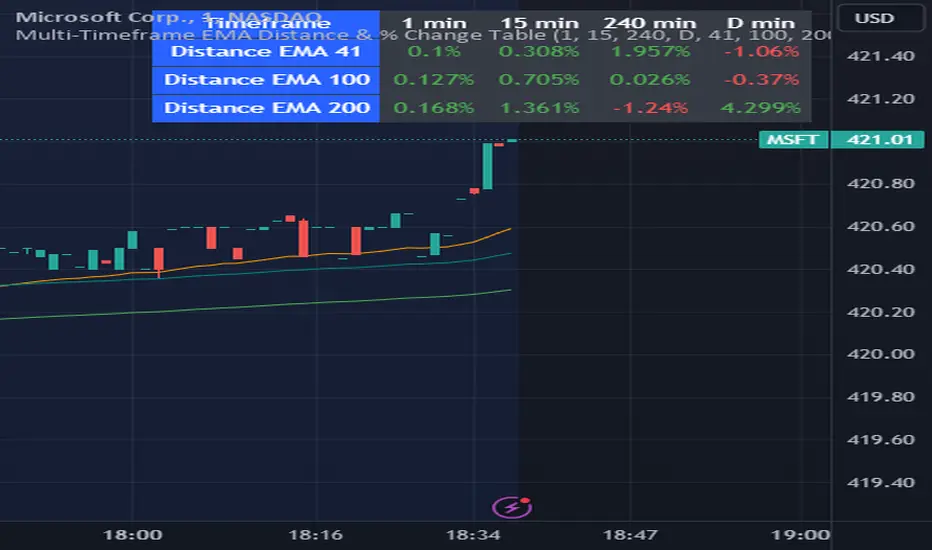
The Multi-Timeframe EMA Distance & % Change Table indicator is designed to display the distance and percentage change between the current price and the Exponential Moving Averages (EMAs) on multiple timeframes. It creates a table to show these values, with customizable options for decimal precision.
Key Features:
This indicator provides a comprehensive overview of EMA distances and percentage changes across multiple timeframes, with detailed control over the precision of the displayed values.
The Multi-Timeframe EMA Distance & % Change Table indicator is designed to display the distance and percentage change between the current price and the Exponential Moving Averages (EMAs) on multiple timeframes. It creates a table to show these values, with customizable options for decimal precision.
Key Features:
- Inputs:
- Timeframes (tf1, tf2, tf3, tf4): User-defined timeframes for EMA calculations (e.g., 1 minute, 15 minutes, daily, etc.).
- EMA Levels (emaLevel, emaLevel2, emaLevel3): User-defined periods for three different EMAs. - EMA Calculations:
- Computes EMAs for the specified levels (50, 100, 200) on each of the user-selected timeframes. - Plotting:
- Plots the EMAs on the chart with distinct colors: Orange, Teal, and Green for different EMAs. - Display Options:
- Checkbox (displayAsPercentage): Allows the user to toggle between displaying distances or percentage changes.
- Decimal Precision:
- decimalPlacesDistance: Specifies the number of decimal places for rounded distance values.
- decimalPlacesPercentage: Specifies the number of decimal places for rounded percentage values. - Table Creation:
- Location: Table is placed in the top-right corner of the chart.
- Headers: Includes columns for each timeframe and EMA distance/percentage. - Distance and Percentage Calculations:
- Distances: Calculated as the difference between the current price and the EMA values for each timeframe.
- Percentages: Calculated as the distance divided by the EMA value, converted to a percentage. - Decimal Rounding:
- Custom Rounding Function: Ensures that distance and percentage values are displayed with the user-specified number of decimal places. - Color Coding:
- Distance Values: Colored green if positive, red if negative.
- Table Entries: Display either the rounded distance or percentage, based on user selection. - Table Update:
- The table is dynamically updated with either distance or percentage values based on the user's choice and rounded to the specified number of decimal places.
This indicator provides a comprehensive overview of EMA distances and percentage changes across multiple timeframes, with detailed control over the precision of the displayed values.
Open-source script
In true TradingView spirit, the author of this script has published it open-source, so traders can understand and verify it. Cheers to the author! You may use it for free, but reuse of this code in publication is governed by House rules. You can favorite it to use it on a chart.
Disclaimer
The information and publications are not meant to be, and do not constitute, financial, investment, trading, or other types of advice or recommendations supplied or endorsed by TradingView. Read more in the Terms of Use.