OPEN-SOURCE SCRIPT
Updated [blackcat] L2 Twisted Pair Indicator
On the grand stage of the financial market, every trader is looking for a partner who can lead them to dance the tango well. The "Twisted Pair" indicator is that partner who dances gracefully in the market fluctuations. It weaves the rhythm of the market with two lines, helping traders to find the rhythm in the market's dance floor.
Imagine when the market is as calm as water, the "Twisted Pair" is like two ribbons tightly intertwined. They almost overlap on the chart, as if whispering: "Now, let's enjoy these quiet dance steps." This is the market consolidation period, the price fluctuation is not significant, traders can relax and slowly savor every detail of the market.
Now, let's describe the market logic of this code in natural language:
- **HJ_1**: This is the foundation of the market dance steps, by calculating the average price and trading volume, setting the tone for the market rhythm.
- **HJ_2** and **HJ_3**: These two lines are the arms of the dance partner, they help traders identify the long-term trend of the market through smoothing.
- **HJ_4**: This is a magnifying glass for market sentiment, it reveals the tension and excitement of the market by calculating the short-term deviation of the price.
- **A7** and **A9**: These two lines are the guide to the dance steps, they separate when the market volatility increases, guiding the traders in the right direction.
- **WATCH**: This is the signal light of the dance, when the two lines overlap, the market is calm; when they separate, the market is active.
The "Twisted Pair" indicator is like a carefully choreographed dance, it allows traders to find their own rhythm in the market dance floor, whether in a calm slow dance or a passionate tango. Remember, the market is always changing, and the "Twisted Pair" is the perfect dance partner that can lead you to dance out brilliant steps.
The script of this "Twisted Pair" uses three different types of moving averages: EMA (Exponential Moving Average), DEMA (Double EMA), and TEMA (Triple EMA). These types can be selected by the user through exchange input.
Here are the main functions of this code:
1. Defined the DEMA and TEMA functions: These two functions are used to calculate the corresponding moving averages. EMA is the exponential moving average, which is a special type of moving average that gives more weight to recent data. In the first paragraph, ema1 is the EMA of "length", and ema2 is the EMA of ema1. DEMA is 2 times of ema1 minus ema2.
2. Let users choose to use EMA, DEMA or TEMA: This part of the code provides an option for users to choose which type of moving average they want to use.
3. Defined an algorithm called "Twisted Pair algorithm": This part of the code defines a complex algorithm to calculate a value called "HJ". This algorithm involves various complex calculations and applications of EMA, DEMA, TEMA.
4. Plotting charts: The following code is used to plot charts on Tradingview. It uses the plot function to draw lines, the plotcandle function to draw candle (K-line) charts, and yellow and red to represent different conditions.
5. Specify colors: The last two lines of code use yellow and red K-line charts to represent the conditions of HJ_7. If the conditions of HJ_7 are met, the color of the K-line chart will change to the corresponding color.
Release Notes
OVERVIEWThe [blackcat] L2 Twisted Pair Indicator is a sophisticated tool designed to help traders identify potential buy and sell opportunities using a combination of moving averages and Heikin-Ashi techniques. This indicator provides clear visual signals on the chart, making it easier to spot market trends and reversals. With customizable moving average types, it offers flexibility for different trading styles 📈💹.
FEATURES
Supports multiple moving average types:
Exponential Moving Average (EMA)
Double Exponential Moving Average (DEMA)
Triple Exponential Moving Average (TEMA)
Utilizes Heikin-Ashi techniques to smooth price action and reduce noise 📊
Plots key levels on the chart:
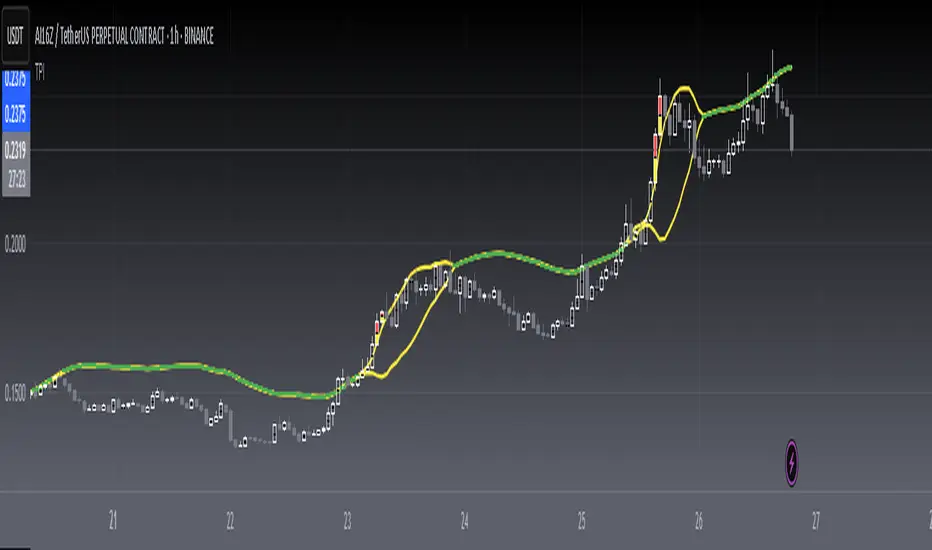
Yellow lines represent calculated Heikin-Ashi values.
Green line indicates the watch value for potential trade setups.
Displays buy ('BUY') and sell ('SELL') labels on the chart for quick identification 🏷️
Generates alerts based on specific conditions for timely notifications 🔔
Customizable appearance with adjustable colors and line widths ⚙️
HOW TO USE
Add the indicator to your TradingView chart by selecting it from the indicators list.
Choose your preferred moving average type (EMA, DEMA, or TEMA) in the settings panel.
Monitor the chart for buy and sell labels indicating potential trade opportunities.
Set up alerts based on the generated signals to receive notifications when conditions are met 📲.
Use the plotted lines as reference points for confirming trend direction and strength.
LIMITATIONS
The indicator may generate false signals in highly volatile or ranging markets 🌪️.
Users should combine this indicator with other forms of analysis for more reliable trading decisions.
The effectiveness of the indicator may vary depending on the asset and timeframe being analyzed.
NOTES
Ensure that you have sufficient historical data available for accurate calculations.
Test the indicator thoroughly on demo accounts before applying it to live trading 🔍.
Customize the appearance and parameters as needed to fit your trading strategy.
Open-source script
In true TradingView spirit, the creator of this script has made it open-source, so that traders can review and verify its functionality. Kudos to the author! While you can use it for free, remember that republishing the code is subject to our House Rules.
Avoid losing contact!Don't miss out! The first and most important thing to do is to join my Discord chat now! Click here to start your adventure: discord.com/invite/ZTGpQJq 防止失联,请立即行动,加入本猫聊天群: discord.com/invite/ZTGpQJq
Disclaimer
The information and publications are not meant to be, and do not constitute, financial, investment, trading, or other types of advice or recommendations supplied or endorsed by TradingView. Read more in the Terms of Use.