OPEN-SOURCE SCRIPT
Options Series - MTF 1 and 3 Minute
Objective:
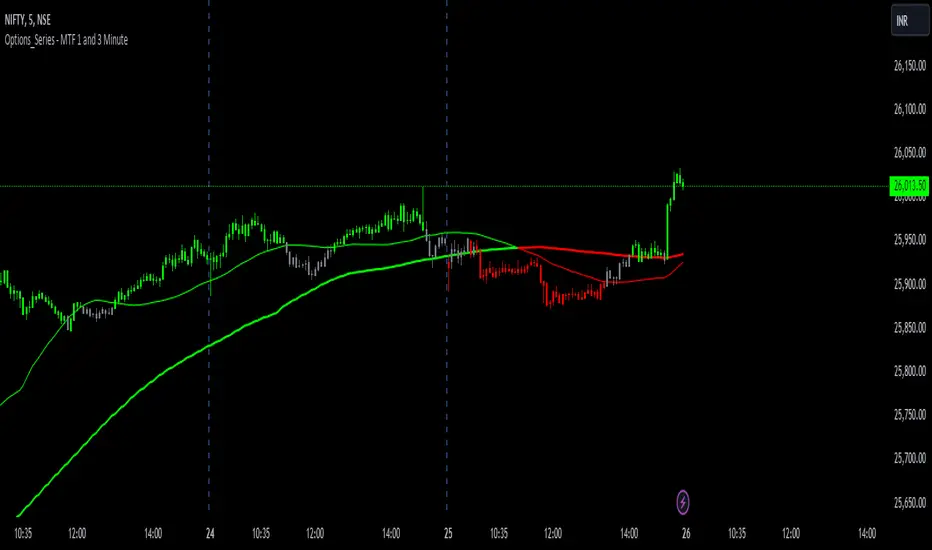
The indicator is named "Options Series - MTF 1 and 3 Minute", suggesting it's designed to analyze options series with multiple time frames (MTF), particularly focusing on 1-minute and 3-minute intervals.
OHLC Values Of Candle:
The code fetches the Open, High, Low, and Close (OHLC) values of the current candle for the specified ticker and timeframes (current, 1 minute, and 3 minutes). Additionally, it calculates the 200-period Simple Moving Average (SMA) of the closing prices for each timeframe.
Bull vs. Bear Condition:
It defines conditions for Bullish and Bearish scenarios based on comparing the current close price with the previous 200-period SMA close price for both 1-minute and 3-minute timeframes. If the current close price is higher than the previous 200-period SMA close price, it's considered Bullish, and if it's lower, it's considered Bearish.
Final Color Condition and Plot:
- It determines the color of the candlestick based on the Bullish or Bearish condition. If the conditions for a Bullish scenario are met, the candlestick color is set to green (GreenColorCandle). If the conditions for a Bearish scenario are met, the candlestick color is set to red (RedColorCandle). If neither condition is met (i.e., the candle is neither Bullish nor Bearish), the color remains gray.
- The code then plots the 200-period SMA values for both 1-minute and 3-minute timeframes and colors them based on the candlestick color. It also colors the bars based on the candlestick color.
Insights:
- This indicator focuses on comparing current close prices with the 200-period SMA close prices to determine market sentiment (Bullish or Bearish).
- It utilizes multiple time frames (1 minute and 3 minutes) to provide a broader perspective on market movements.
- The color-coded candlesticks and bars make it visually easy to identify Bullish and Bearish trends.
- This indicator can be used as part trading based on the identified market sentiment.
Open-source script
In true TradingView spirit, the author of this script has published it open-source, so traders can understand and verify it. Cheers to the author! You may use it for free, but reuse of this code in publication is governed by House rules. You can favorite it to use it on a chart.
Disclaimer
The information and publications are not meant to be, and do not constitute, financial, investment, trading, or other types of advice or recommendations supplied or endorsed by TradingView. Read more in the Terms of Use.