OPEN-SOURCE SCRIPT
High-Low Cloud Trend [ChartPrime]
Updated
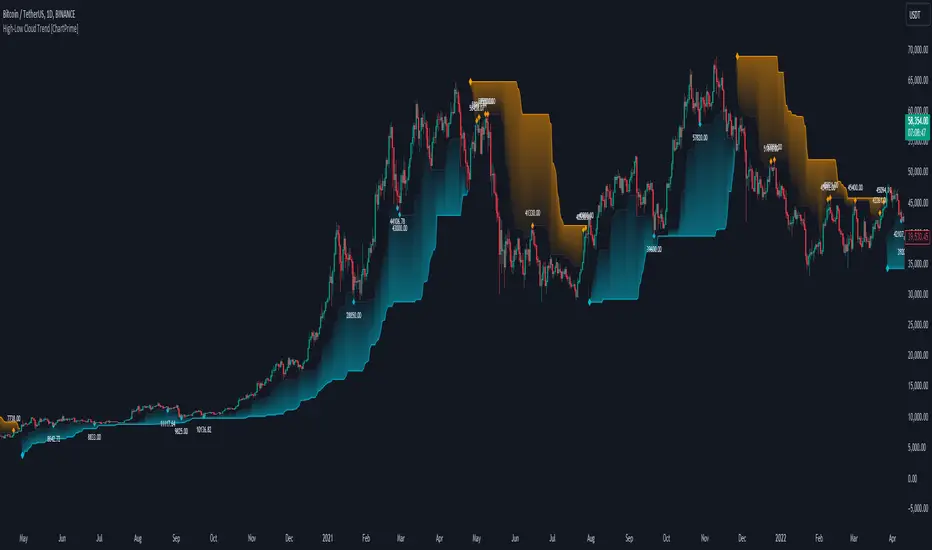
The High-Low Cloud Trend - ChartPrime indicator, combines the concepts of trend following and mean reversion into a dynamic cloud representation. This indicator constructs high and low bands based on lookback periods, which adjust dynamically to reflect market conditions. By highlighting the upper and lower extremes, it provides a visual gauge for potential reversals and continuation points.

◆ KEY FEATURES
◆ FUNCTIONALITY DETAILS
◆ USAGE
⯁ USER INPUTS
The High-Low Cloud Trend indicator is a versatile and powerful tool for traders who engage in both trend following and mean reversion strategies. It provides a clear visual representation of market dynamics, helping traders to make informed decisions based on established and emerging patterns. This indicator's dual approach ensures that it is suitable for various trading styles and market conditions.
◆ KEY FEATURES
- Dynamic Cloud Bands: Uses high and low derived from user-defined lookback periods to create reactive bands that illustrate trend strength and potential reversal zones.
- Color-coded Visualization: Applies distinct colors to the bands based on the trend direction, improving readability and decision-making speed.
- Mean Reversion Detection: Identifies points where price extremes may revert to a mean, signaling potential entry or exit opportunities based on deviation from expected values.
- Flexible Visualization: Offers options to display volume or price-based metrics within labels, enhancing analytical depth.
◆ FUNCTIONALITY DETAILS
- Band Formation: Calculates two sets of bands; one based on a primary lookback period and another for a shorter period to capture mean reversion points.
◆ USAGE
- Trend Confirmation: Use the main bands to confirm the prevailing market trend, with the cloud filling acting as a visual guide.
- Breakout Identification: Monitor for price breaks through the cloud to identify strong momentum that may suggest a viable breakout.
- Risk Management: Adjust positions based on the proximity of price to either band, using these as potential support or resistance areas.
- Mean Reversion Strategies: Apply mean reversion techniques when price touches or crosses the bands, indicating a possible return to a central value.
⯁ USER INPUTS
- Lookback Period: Sets the primary period for calculating high and low bands.
- Mean Reversion Points: Toggles the identification of mean reversion opportunities within the bands.
- Volume/Price Display: Chooses between displaying volume or price information in the indicator's labels for enhanced detail.
The High-Low Cloud Trend indicator is a versatile and powerful tool for traders who engage in both trend following and mean reversion strategies. It provides a clear visual representation of market dynamics, helping traders to make informed decisions based on established and emerging patterns. This indicator's dual approach ensures that it is suitable for various trading styles and market conditions.
Release Notes
Thumb updateOpen-source script
In true TradingView spirit, the author of this script has published it open-source, so traders can understand and verify it. Cheers to the author! You may use it for free, but reuse of this code in publication is governed by House rules. You can favorite it to use it on a chart.
Disclaimer
The information and publications are not meant to be, and do not constitute, financial, investment, trading, or other types of advice or recommendations supplied or endorsed by TradingView. Read more in the Terms of Use.