OPEN-SOURCE SCRIPT
Table: Relative Strength Index (Multiple Timeframes)
Updated
DESCRIPTION
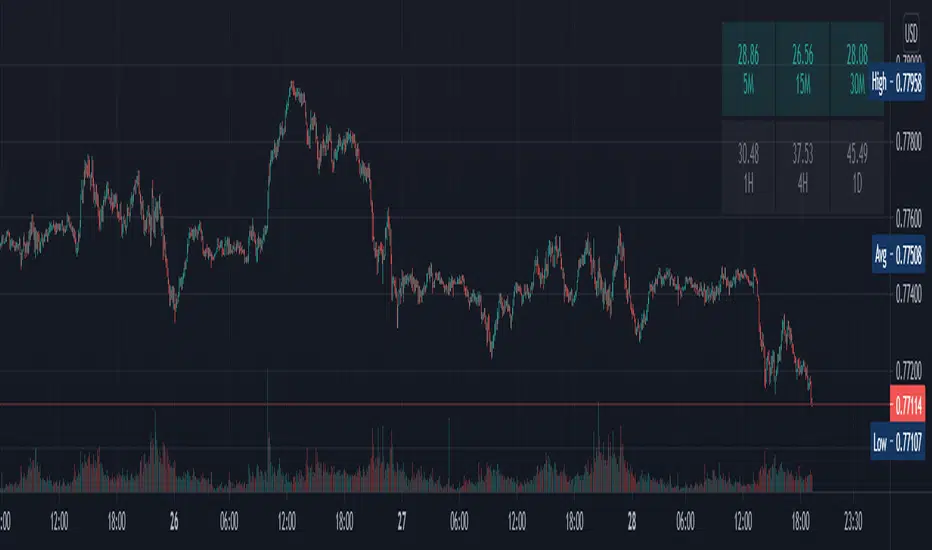
It is the most popular and dependent Indicator, Relative Strength Index (RSI) . Now, I put inside a table to view chart momentum from Multiple timeframes.
This indicator tells different Timeframe (30 minutes, 1 hour, 4 hour, 1 day, 1 week, 1 month) of RSI value within table form.
HOW TO USE
Can consider a Long position when all timeframes go oversold while Short position when all timeframes go overbought. Alarm function is available. It sounds as all timeframes are overbought or oversold.
Modified The source of indicator from ©BeeHolder named "Performance"
Release Notes
Add Intraday or Standard Option, there are 5 minutes and 15 minutes RSI in Intraday, while weekly and monthly in Standard Option.Alarm will follow either Intraday or Standard Option.
Notes: When you are in higher timeframe, all the lowest timeframe will slightly bias. All data will be right when you are opening the lowest timeframe.
Release Notes
Updated: 29 May 2021Release Notes
Correction on Color.Release Notes
Updated: 29 May 2021Open-source script
In true TradingView spirit, the author of this script has published it open-source, so traders can understand and verify it. Cheers to the author! You may use it for free, but reuse of this code in publication is governed by House rules. You can favorite it to use it on a chart.
Disclaimer
The information and publications are not meant to be, and do not constitute, financial, investment, trading, or other types of advice or recommendations supplied or endorsed by TradingView. Read more in the Terms of Use.