OPEN-SOURCE SCRIPT
Volume Tick Experiment
Updated
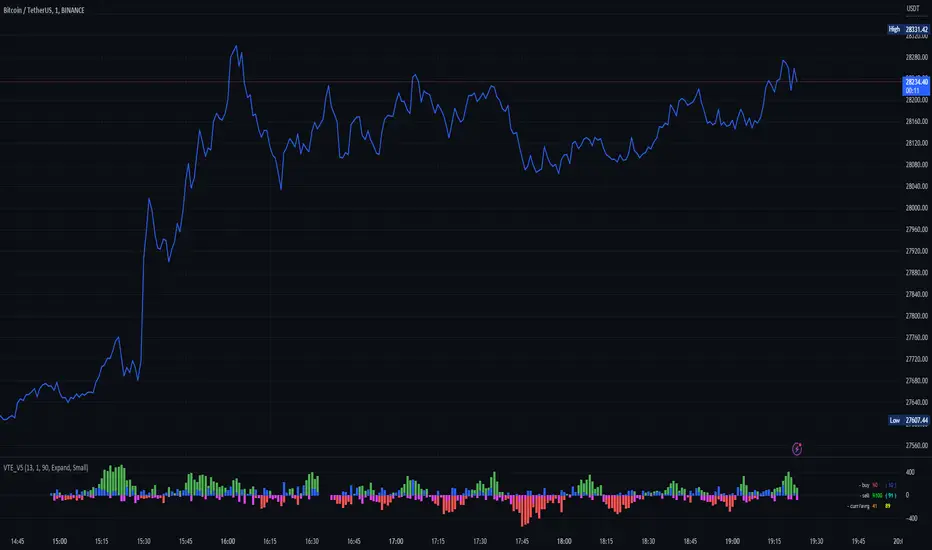
This ticks-based indicator provides real-time volume information for a trading asset. Volume is analyzed and updated continuously, not just at candle close. It is based on DGT's Bull vs Bear Power indicator but adds a gas signal that activates when buying or selling volume percentage reaches a predetermined threshold.
This indicator can also help traders determine the direction and aggressiveness of pushes in buying or selling volume. By monitoring the volume percentages and gas signals, traders can get an idea of whether the market is pushing in a particular direction and how strong the push is. This information can be helpful in making trading decisions and identifying potential entry or exit points.
The indicator uses open, high, low, and close prices of the asset to calculate volume information. It determines the average volume over a selected period and calculates volume for both buying and selling. This information is used to calculate the percentage of buying and selling volume. A gas signal is triggered when either the buying or selling percentage reaches a predetermined threshold.
Enjoy!
Release Notes
Group calculation and drawing better (no algorithm change)Release Notes
Added option to change default line sizeRelease Notes
- More control over options
- Grow/Shrink coloring
Release Notes
Option to allow width of signal display to adjust to candle thickness- now that we have volume candles display mode in TV.Release Notes
Fix BUG: Settings not applied to correct signal.Get access to our indicators at: huntergatherers.tech
Open-source script
In true TradingView spirit, the author of this script has published it open-source, so traders can understand and verify it. Cheers to the author! You may use it for free, but reuse of this code in publication is governed by House rules. You can favorite it to use it on a chart.
Disclaimer
The information and publications are not meant to be, and do not constitute, financial, investment, trading, or other types of advice or recommendations supplied or endorsed by TradingView. Read more in the Terms of Use.