OPEN-SOURCE SCRIPT
Radius Trend [ChartPrime]
RADIUS TREND
⯁ OVERVIEW
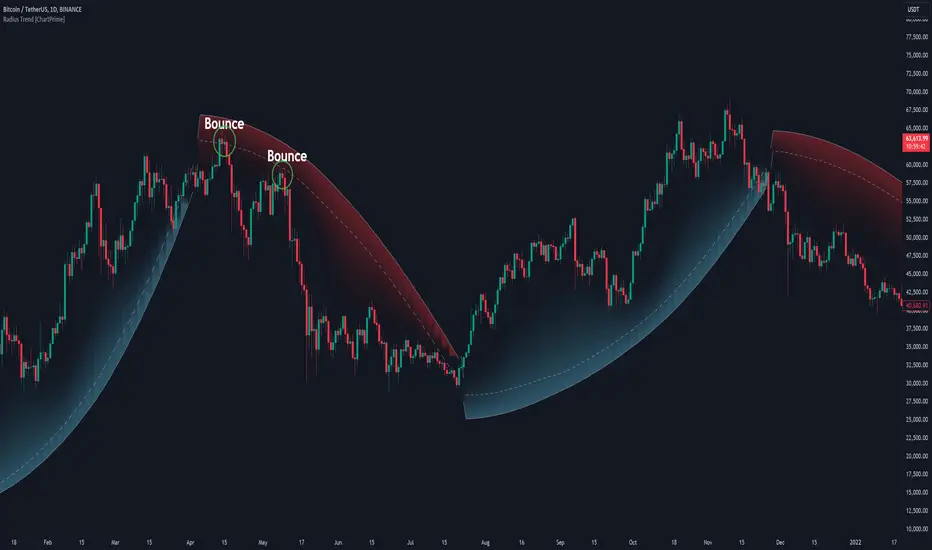
The Radius Trend [ChartPrime] indicator is an innovative technical analysis tool designed to visualize market trends using a dynamic, radius-based approach. By incorporating adaptive bands that adjust based on price action and volatility, this indicator provides traders with a unique perspective on trend direction, strength, and potential reversal points.
The Radius Trend concept involves creating a dynamic trend line that adjusts its angle and position based on market movements, similar to a radius sweeping across a chart. This approach allows for a more fluid and adaptive trend analysis compared to traditional linear trend lines.

◆ KEY FEATURES
◆ USAGE
⯁ USER INPUTS
The Radius Trend indicator offers traders a unique and dynamic approach to trend analysis. By combining radius-based trend adjustments with volatility-sensitive calculations, it provides a fluid representation of market trends. This indicator is particularly useful for traders looking to identify trend persistence, potential reversal points, and adaptive support/resistance levels across various market conditions and timeframes.
⯁ OVERVIEW
The Radius Trend [ChartPrime] indicator is an innovative technical analysis tool designed to visualize market trends using a dynamic, radius-based approach. By incorporating adaptive bands that adjust based on price action and volatility, this indicator provides traders with a unique perspective on trend direction, strength, and potential reversal points.
The Radius Trend concept involves creating a dynamic trend line that adjusts its angle and position based on market movements, similar to a radius sweeping across a chart. This approach allows for a more fluid and adaptive trend analysis compared to traditional linear trend lines.
◆ KEY FEATURES
- Dynamic Trend Band: Calculates and plots a main trend band that adapts to market conditions.
- Radius-Based Adjustment: Uses a step-based radius approach to adjust the trend band angle.
- Volatility-Adjusted Calculations: Incorporates price range volatility for more accurate band placement.
- Trend Direction Visualization: Provides clear color-coding to distinguish between uptrends and downtrends.
- Flexible Parameters: Allows users to adjust the radius step and initial distance for customized analysis.
◆ USAGE
- Trend Identification: Use the color and direction of the main band to determine the current market trend.
- Trend Strength Analysis: Observe the angle and consistency of the band for insights into trend strength.
- Reversal Detection: Watch for price crossing the main band or crossing a dashed band as a potential trend reversal signal.
- Volatility Assessment: The distance between price and bands can provide insights into market volatility.
⯁ USER INPUTS
- Radius Step: Controls the rate of angle adjustment for the trend band (default: 0.15, step: 0.001).
- Start Points Distance: Sets the initial distance multiplier for band calculations (default: 2, step: 0.1).
The Radius Trend indicator offers traders a unique and dynamic approach to trend analysis. By combining radius-based trend adjustments with volatility-sensitive calculations, it provides a fluid representation of market trends. This indicator is particularly useful for traders looking to identify trend persistence, potential reversal points, and adaptive support/resistance levels across various market conditions and timeframes.
Open-source script
In true TradingView spirit, the author of this script has published it open-source, so traders can understand and verify it. Cheers to the author! You may use it for free, but reuse of this code in publication is governed by House rules. You can favorite it to use it on a chart.
Disclaimer
The information and publications are not meant to be, and do not constitute, financial, investment, trading, or other types of advice or recommendations supplied or endorsed by TradingView. Read more in the Terms of Use.