PROTECTED SOURCE SCRIPT
PTF_UpDownVolatility for Profit Trailer Feeder
Updated
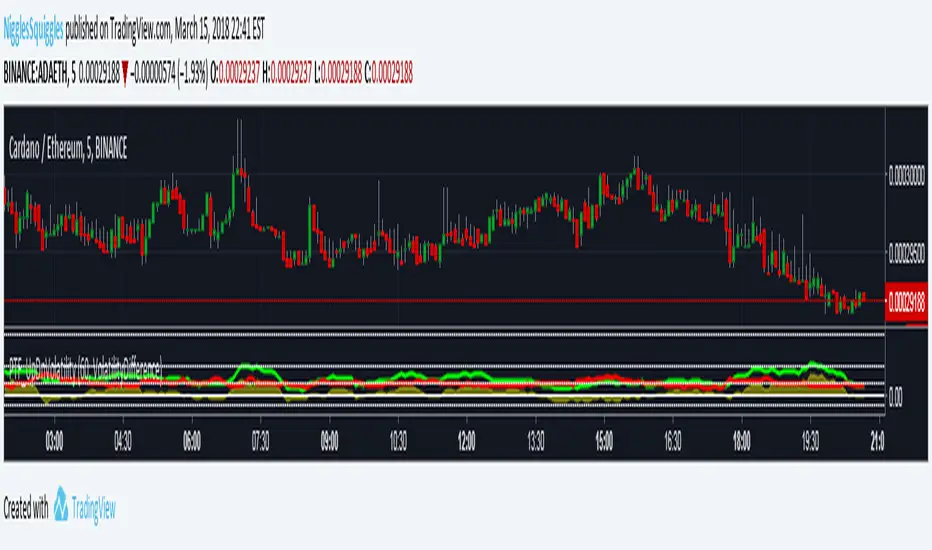
This indicator for Profit Trailer Feeder plots out the values for four different Offset Groups:
1) Upside Volatility - green line
2) Downside Volatility - red line
3) Average Candle Size - orange histogram
4) UpsideDownsideVolatilityDifference - orange histogram
The user can switch between viewing histogram as either Average Candle Size or UpsideDownsideVolatilityDifference
1) Upside Volatility - green line
2) Downside Volatility - red line
3) Average Candle Size - orange histogram
4) UpsideDownsideVolatilityDifference - orange histogram
The user can switch between viewing histogram as either Average Candle Size or UpsideDownsideVolatilityDifference
Release Notes
I had a request to add a "Tip Jar" for those who wanted to express their thanks for these indicators.So if you want to say thanks, then you're welcome:
LTC Tip Jar: LX4bUBdjiRPsagUbZoAczSGgDC4YqTJL7w
Release Notes
Now includes Short, Medium and Long term volatility calculations for upside, downside, average candle size and volatility difference.Added the ability to switch on and off various elements from the main settings tab.
Colour coded Histogram to the three time scales.
Release Notes
Fixed an error in the downside volatility calculations. Now displays more accurate values.Also, if you don't already have Profit Trailer Feeder, feel free to use the link below.
cryptoprofitbot.com/?ref=Squiggles
Disclaimer
The information and publications are not meant to be, and do not constitute, financial, investment, trading, or other types of advice or recommendations supplied or endorsed by TradingView. Read more in the Terms of Use.