OPEN-SOURCE SCRIPT
Weekly Range Support & Resistance Levels [QuantVue]
Updated
Weekly Range Support & Resistance Levels
Description:
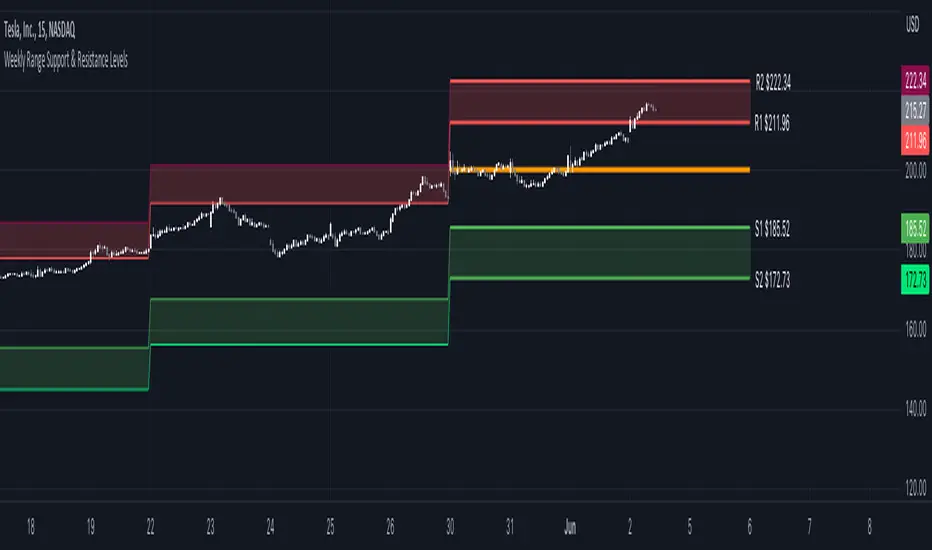
The Weekly Range Support & Resistance Levels analyzes weekly ranges and takes the average range of the last 30 weeks (default setting).
It also takes the average +/- a standard deviation, and creates support & resistance levels/zones based on the weekly opening price.
The levels will update each week, and previous weekly levels can be toggled on or off.
Settings:
🔹Averaging Period
🔹Standard Deviation Multiplier
🔹Toggle Support & Resistance Prices
🔹Show Weekly Open Line
🔹Show Previous Levels
Don't hesitate to reach out with any questions or concerns. We hope you enjoy!
Cheers.
Description:
The Weekly Range Support & Resistance Levels analyzes weekly ranges and takes the average range of the last 30 weeks (default setting).
It also takes the average +/- a standard deviation, and creates support & resistance levels/zones based on the weekly opening price.
The levels will update each week, and previous weekly levels can be toggled on or off.
Settings:
🔹Averaging Period
🔹Standard Deviation Multiplier
🔹Toggle Support & Resistance Prices
🔹Show Weekly Open Line
🔹Show Previous Levels
Don't hesitate to reach out with any questions or concerns. We hope you enjoy!
Cheers.
Release Notes
Updated code for the standard deviations and to see weekly open on previous levels.Release Notes
Fixed error for the indicator to show properly on certain indexes. Get Access to the exclusive QuantVue indicators: quantvue.io/
Join thousands of traders in our Free Discord: discord.gg/tC7u7magU3
Join thousands of traders in our Free Discord: discord.gg/tC7u7magU3
Open-source script
In true TradingView spirit, the author of this script has published it open-source, so traders can understand and verify it. Cheers to the author! You may use it for free, but reuse of this code in publication is governed by House rules. You can favorite it to use it on a chart.
Disclaimer
The information and publications are not meant to be, and do not constitute, financial, investment, trading, or other types of advice or recommendations supplied or endorsed by TradingView. Read more in the Terms of Use.