OPEN-SOURCE SCRIPT
Dynamic Sine Wave

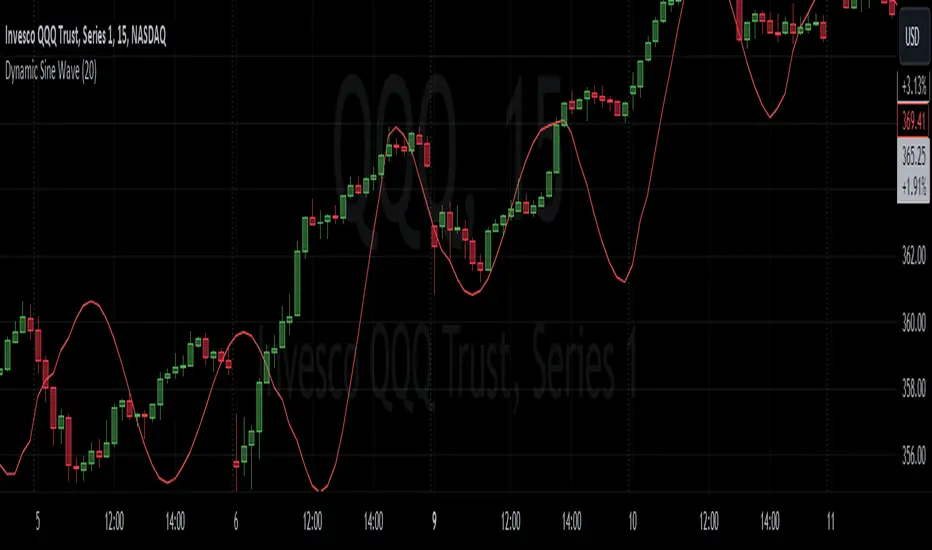
The Dynamic Sine Wave is designed to calculate a sine wave that reflects the oscillations between the highest high and lowest low points over a specified period, providing traders with a unique perspective on market trends.
Why a Sine Wave is Relevant:
Overall, the "Dynamic Sine Wave" indicator offers a unique perspective on market dynamics, helping traders make informed decisions by visualizing the ebb and flow of prices.
Why a Sine Wave is Relevant:
- A sine wave is relevant in this context because it is a mathematical function that represents periodic oscillations, making it suitable for capturing the cyclic nature of price movements in financial markets.
- By using a sine wave, this indicator highlights the repetitive patterns of price highs and lows over a specified period, which can assist traders in identifying potential trend reversals or continuations.
- The sine wave's amplitude and frequency are adjusted based on the highest high and lowest low points, ensuring that it adapts to market volatility and provides a dynamic representation of price action.
Overall, the "Dynamic Sine Wave" indicator offers a unique perspective on market dynamics, helping traders make informed decisions by visualizing the ebb and flow of prices.
Open-source script
In true TradingView spirit, the author of this script has published it open-source, so traders can understand and verify it. Cheers to the author! You may use it for free, but reuse of this code in publication is governed by House rules. You can favorite it to use it on a chart.
KP
Disclaimer
The information and publications are not meant to be, and do not constitute, financial, investment, trading, or other types of advice or recommendations supplied or endorsed by TradingView. Read more in the Terms of Use.