OPEN-SOURCE SCRIPT
RSI Supply / Demand Zones
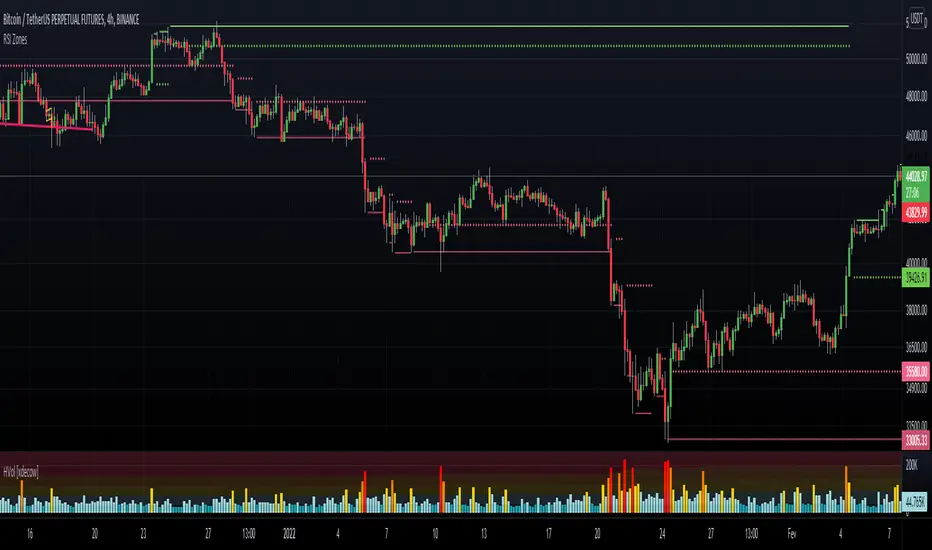
Lines plotted for the Low and High of the region of price that was Overbought or Oversold
(Low of the candle that became overbought and highest high in the Overbought period)
(High of the candle that became oversold and highest high in the Oversold period)
I like to use the dotted lines as pivot points for the reversal of the trend, and also pay attention to small tops and bottoms (normal lines) that form in strong trends, as they usually make for brief periods of acummulation/distribution before the continuation of the strong trend.
Open-source script
In true TradingView spirit, the author of this script has published it open-source, so traders can understand and verify it. Cheers to the author! You may use it for free, but reuse of this code in publication is governed by House rules. You can favorite it to use it on a chart.
Disclaimer
The information and publications are not meant to be, and do not constitute, financial, investment, trading, or other types of advice or recommendations supplied or endorsed by TradingView. Read more in the Terms of Use.