OPEN-SOURCE SCRIPT
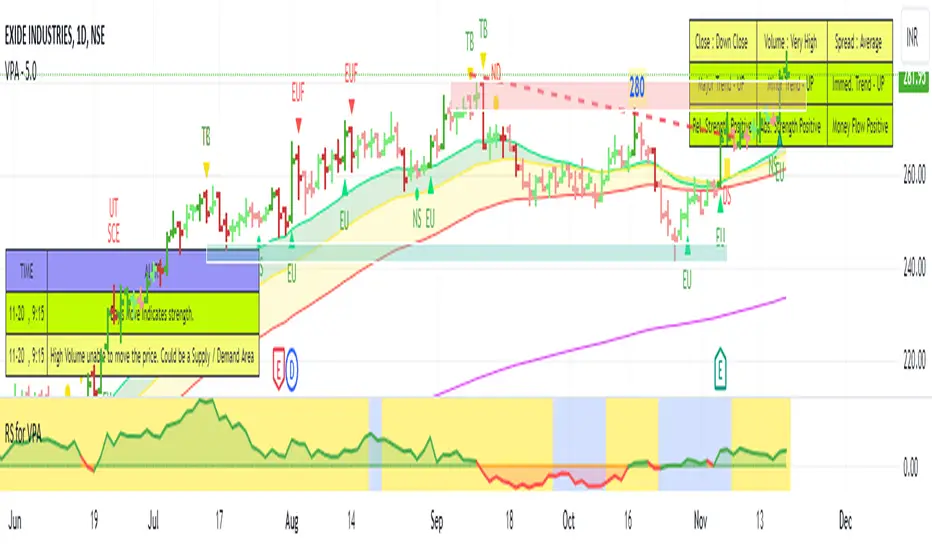
RS for VPA

This is a supporting Indicator for the Volume Price Analysis Script VPA 5.0.
Purpose
To indicate the performance of the stock compared to an Index or any other selected stock. It also provides an idea about the strength of the Reference Index as well.
Description
The indicator is an unbound oscillator moving around a zero line. If the stock is strong then the values are positive and if it is weak the values are negative. If the stock is performing better (Stronger) than the Index the indicator is positive and colored green. If the stock is weaker than the Index it is negative and is colored Red.
The background indicates the strength of the Reference Index/Stock. Bullishness/up trend of the Index/Stock is indicated by yellow colour. Short term uptrend, Mid term uptrend and Long term trends are indicated by different shades of yellow varying from light to Dark. The bearishness / down trend is indicated by blue back ground.
How it Works
The relative strength is calculated by using the formula
RS = Gain of the stock / (Gain of the Ref. Index -1)
= (Stock Price today / Stock Price (N period ago)) /
(Index Price today / Index price (N period ago)) – 1
The Index strength is calculated as below
Short term trend up = 5 ema > 22 ema
Mid Term trend up = 22 ema > 60 ema
Long term trend up = 60 ema > 130 ema
Trend down = 5 ema < 22 ema
How to use
Use this indicator to assist your Price Action Analysis using VPA 5.0. When the Price action and volume indicates Bullishness, you can check if the relative strength is also supporting (Positive and in green Territory). This adds credibility to the Price action. Also check if the index is also positive (the Back ground is yellow). This makes the Price action even stronger. Ideally both the stock and index should be strong. Many time you would find the that the stock is in green territory but the index is in blue territory. This calls for some caution in evaluating the Price Action.
When the price action is positive but the relative strength is negative then one should be cautious and wait for the relative strength to turn positive before any entry decision.
Option for the Indicator
One can select the following from the setting for the indicator
1. Index or reference stock – Default is CNX 500
2. Relative Strength Calculation period – Default is 22
3. The EMA periods for the Index/Reference stock strength calculation
Open-source script
In true TradingView spirit, the author of this script has published it open-source, so traders can understand and verify it. Cheers to the author! You may use it for free, but reuse of this code in publication is governed by House rules. You can favorite it to use it on a chart.
Disclaimer
The information and publications are not meant to be, and do not constitute, financial, investment, trading, or other types of advice or recommendations supplied or endorsed by TradingView. Read more in the Terms of Use.