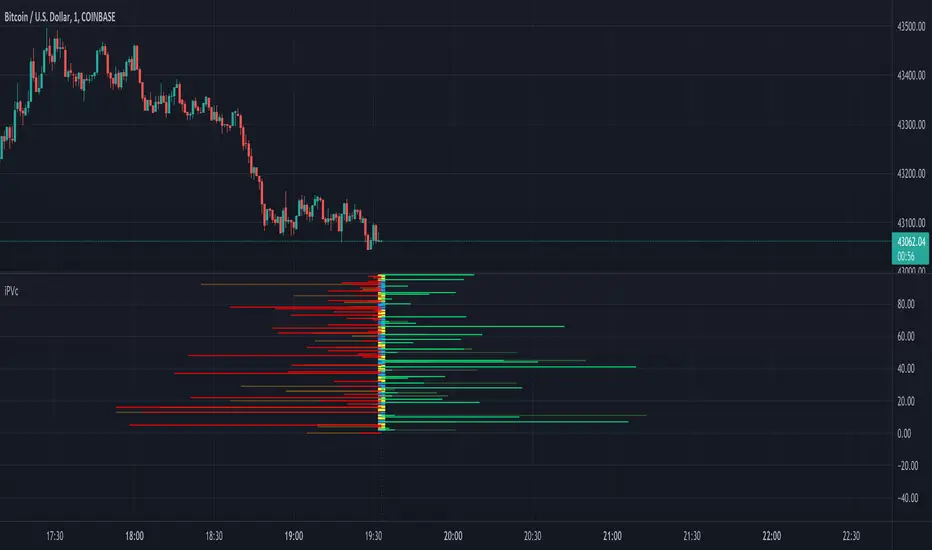
This experimental script shows the intrabar progression of price/volume
It can only be used with live data, when you switch timeframe or ticker, it will start over again.
When you let the script run, you'll get insight of what is going on during the bar progression.
On each tick, when the price goes up, a green line will be drawn,
if it goes down, a red line is drawn. The higher the difference with previous price, the wider the line.
The same with volume (lighter, broader lines), only it will always be drawn in the same direction as price goes.

You can set the max width of the lines, when a spike is larger then previous lines, the rest will be adjusted, so the ratio stays the same


The center line (position can be changed) has 2 colors (only on second and minute timeframes) -> this makes it easy to see the bar progression, each change in color represents a new bar

Lines can be drawn on 2 sides, or at 1 side, also they can be reversed
Many thanks to LonesomeTheBlue and LucF for their inspiration, help and guidance!
Cheers!
It can only be used with live data, when you switch timeframe or ticker, it will start over again.
When you let the script run, you'll get insight of what is going on during the bar progression.
On each tick, when the price goes up, a green line will be drawn,
if it goes down, a red line is drawn. The higher the difference with previous price, the wider the line.
The same with volume (lighter, broader lines), only it will always be drawn in the same direction as price goes.
You can set the max width of the lines, when a spike is larger then previous lines, the rest will be adjusted, so the ratio stays the same
The center line (position can be changed) has 2 colors (only on second and minute timeframes) -> this makes it easy to see the bar progression, each change in color represents a new bar
Lines can be drawn on 2 sides, or at 1 side, also they can be reversed
Many thanks to LonesomeTheBlue and LucF for their inspiration, help and guidance!
Cheers!
LuxAlgo Dev: luxalgo.com
PineCoder: pinecoders.com
- We cannot control our emotions,
but we can control our keyboard -
PineCoder: pinecoders.com
- We cannot control our emotions,
but we can control our keyboard -
Open-source script
In true TradingView spirit, the author of this script has published it open-source, so traders can understand and verify it. Cheers to the author! You may use it for free, but reuse of this code in publication is governed by House rules. You can favorite it to use it on a chart.
Disclaimer
The information and publications are not meant to be, and do not constitute, financial, investment, trading, or other types of advice or recommendations supplied or endorsed by TradingView. Read more in the Terms of Use.