OPEN-SOURCE SCRIPT
[SK] Double MACD
Updated

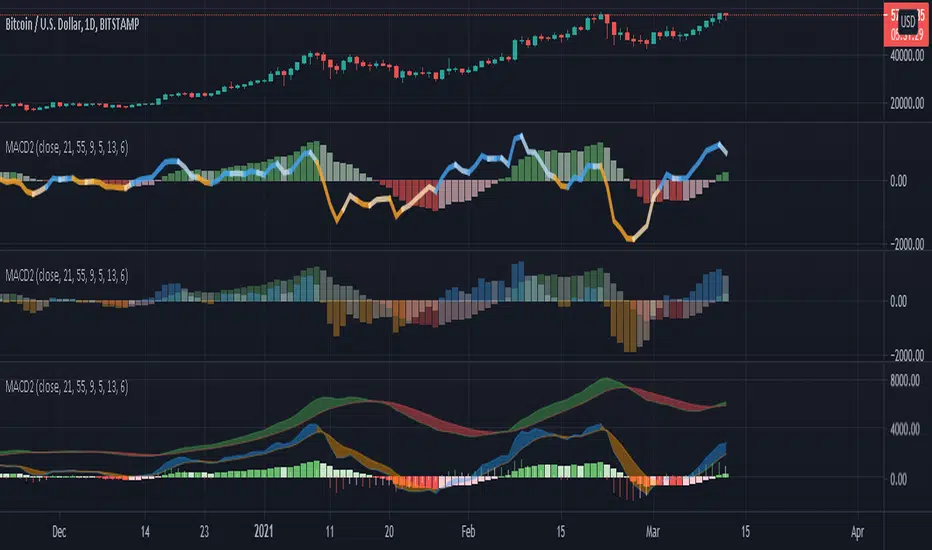
The Double MACD indicator is precisely two different MACD indicators plotted on the same axis for precise visual correlation between each other.
This correlation provides more information than a single regular MACD by allowing you to compare the signals of a shorter timeframe to the default or longer timeframe,
showing the strength of the change in momentum and the peak of the momentum between both configurations.
The indicator has cloud options by default if you toggle on the MACD / Signal lines for better readability.
The cloud will change color to the line on top of it's set. This is to help you not get lost in the 4 different lines.
Customize the indicator to your preference and make it your own
- If you'd like a candle like visualization, change the short MACD plot style to a histogram.
- For a beautiful double bars style, select bars on both configurations and set the transparency to 30 - 40
- For a dynamic moving average style, go with the line plot style ( default )
- All MACD/Signal lines are toggled off by default, toggle them on in the inputs section.
- On the styles panel, you can turn off the cloud fills or the lines.
- Change all the colors you'd like!
Release Notes
The MACD2 is precisely two different MACD indicators plotted on the same axis for precise visual correlation.This provides better and faster signals than a single MACD by showing the signals of short and long range of time together.
The correlation between them provides information on the strength of the momentum in the current direction and when this momentum peaks.
The indicator has cloud fills for the usual plots of the MACD and Signal lines for better readability.
The cloud will change color to the higher value of it's pair.
These cloud fills help you not get lost in the 4 different lines if you like to toggle them on.
On the screenshot you can see different configurations of how you can use the indicator.
Play around with the configurations on the style inputs to add your own style and make it yours.
The different styles on the screenshot have the following configurations:
Classic MACD with Short Time Line
This is the default configuration setting the long time to bars and short time to line.
The line still benefits from the directional color coding the MACD is built with, thickness is recommended.
Candle Bars
For the candle bars style set the short time to histogram and thickness to 1 or 2.
This view has the clouds enabled as an example, you toggle them on/off on the inputs panel and could turn off the fill if preferred.
Candy Ghost Bars
This is the nicest looking and is also clear to read. For this select plot style of bars on both long and short with the transparency at 35.
MACD / Signal lines
These are toggled off by default, toggle them on in the inputs section.
On the styles panel, you can turn off the cloud fills or the lines.
Open-source script
In true TradingView spirit, the author of this script has published it open-source, so traders can understand and verify it. Cheers to the author! You may use it for free, but reuse of this code in publication is governed by House rules. You can favorite it to use it on a chart.
Disclaimer
The information and publications are not meant to be, and do not constitute, financial, investment, trading, or other types of advice or recommendations supplied or endorsed by TradingView. Read more in the Terms of Use.