Editors' picksOPEN-SOURCE SCRIPT
Machine Learning Adaptive SuperTrend [AlgoAlpha]
📈🤖 Machine Learning Adaptive SuperTrend [AlgoAlpha] - Take Your Trading to the Next Level! 🚀✨
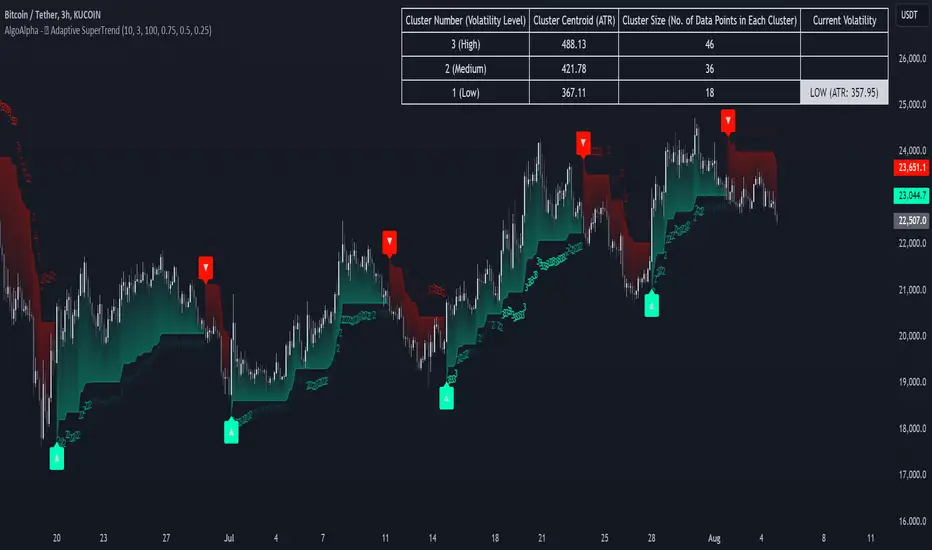
Introducing the Machine Learning Adaptive SuperTrend, an advanced trading indicator designed to adapt to market volatility dynamically using machine learning techniques. This indicator employs k-means clustering to categorize market volatility into high, medium, and low levels, enhancing the traditional SuperTrend strategy. Perfect for traders who want an edge in identifying trend shifts and market conditions.
What is K-Means Clustering and How It Works
K-means clustering is a machine learning algorithm that partitions data into distinct groups based on similarity. In this indicator, the algorithm analyzes ATR (Average True Range) values to classify volatility into three clusters: high, medium, and low. The algorithm iterates to optimize the centroids of these clusters, ensuring accurate volatility classification.
Key Features
Quick Guide to Using the Machine Learning Adaptive SuperTrend Indicator
🛠 Add the Indicator: Add the indicator to favorites by pressing the star icon. Customize settings like ATR length, SuperTrend factor, and volatility percentiles to fit your trading style.

📊 Market Analysis: Observe the color changes and SuperTrend line for trend reversals. Use the data table to monitor volatility clusters.

🔔 Alerts: Enable notifications for trend shifts and volatility changes to seize trading opportunities without constant chart monitoring.

How It Works
The indicator begins by calculating the ATR values over a specified training period to assess market volatility. Initial guesses for high, medium, and low volatility percentiles are inputted. The k-means clustering algorithm then iterates to classify the ATR values into three clusters. This classification helps in determining the appropriate volatility level to apply to the SuperTrend calculation. As the market evolves, the indicator dynamically adjusts, providing real-time trend and volatility insights. The indicator also incorporates a data table displaying cluster centroids, sizes, and the current volatility level, aiding traders in making informed decisions.
Add the Machine Learning Adaptive SuperTrend to your TradingView charts today and experience a smarter way to trade! 🌟📊
Introducing the Machine Learning Adaptive SuperTrend, an advanced trading indicator designed to adapt to market volatility dynamically using machine learning techniques. This indicator employs k-means clustering to categorize market volatility into high, medium, and low levels, enhancing the traditional SuperTrend strategy. Perfect for traders who want an edge in identifying trend shifts and market conditions.
What is K-Means Clustering and How It Works
K-means clustering is a machine learning algorithm that partitions data into distinct groups based on similarity. In this indicator, the algorithm analyzes ATR (Average True Range) values to classify volatility into three clusters: high, medium, and low. The algorithm iterates to optimize the centroids of these clusters, ensuring accurate volatility classification.
Key Features
- 🎨 Customizable Appearance: Adjust colors for bullish and bearish trends.
- 🔧 Flexible Settings: Configure ATR length, SuperTrend factor, and initial volatility guesses.
- 📊 Volatility Classification: Uses k-means clustering to adapt to market conditions.
- 📈 Dynamic SuperTrend Calculation: Applies the classified volatility level to the SuperTrend calculation.
- 🔔 Alerts: Set alerts for trend shifts and volatility changes.
- 📋 Data Table Display: View cluster details and current volatility on the chart.
Quick Guide to Using the Machine Learning Adaptive SuperTrend Indicator
🛠 Add the Indicator: Add the indicator to favorites by pressing the star icon. Customize settings like ATR length, SuperTrend factor, and volatility percentiles to fit your trading style.
📊 Market Analysis: Observe the color changes and SuperTrend line for trend reversals. Use the data table to monitor volatility clusters.
🔔 Alerts: Enable notifications for trend shifts and volatility changes to seize trading opportunities without constant chart monitoring.
How It Works
The indicator begins by calculating the ATR values over a specified training period to assess market volatility. Initial guesses for high, medium, and low volatility percentiles are inputted. The k-means clustering algorithm then iterates to classify the ATR values into three clusters. This classification helps in determining the appropriate volatility level to apply to the SuperTrend calculation. As the market evolves, the indicator dynamically adjusts, providing real-time trend and volatility insights. The indicator also incorporates a data table displaying cluster centroids, sizes, and the current volatility level, aiding traders in making informed decisions.
Add the Machine Learning Adaptive SuperTrend to your TradingView charts today and experience a smarter way to trade! 🌟📊
Release Notes
Fixed an error in the data tableRelease Notes
Modified alerts to fire only after bar close.Release Notes
Implemented optimisations to make the script more efficient. Credits to PineCoders for the suggestions.Release Notes
Added the ability to customize the trailing fill's transparency.Open-source script
In true TradingView spirit, the creator of this script has made it open-source, so that traders can review and verify its functionality. Kudos to the author! While you can use it for free, remember that republishing the code is subject to our House Rules.
For quick access on a chart, add this script to your favorites — learn more here.
🔱Get 15% OFF our VIP Bundle!🔱(Sale Ends soon)
Code: ALPHA
🚨Get premium: algoalpha.io
🛜Get FREE signals: discord.gg/xCmqTVRexz
❓Do you have feedback or indicator ideas? Join our server to tell us about it!
Code: ALPHA
🚨Get premium: algoalpha.io
🛜Get FREE signals: discord.gg/xCmqTVRexz
❓Do you have feedback or indicator ideas? Join our server to tell us about it!
Disclaimer
The information and publications are not meant to be, and do not constitute, financial, investment, trading, or other types of advice or recommendations supplied or endorsed by TradingView. Read more in the Terms of Use.
Open-source script
In true TradingView spirit, the creator of this script has made it open-source, so that traders can review and verify its functionality. Kudos to the author! While you can use it for free, remember that republishing the code is subject to our House Rules.
For quick access on a chart, add this script to your favorites — learn more here.
🔱Get 15% OFF our VIP Bundle!🔱(Sale Ends soon)
Code: ALPHA
🚨Get premium: algoalpha.io
🛜Get FREE signals: discord.gg/xCmqTVRexz
❓Do you have feedback or indicator ideas? Join our server to tell us about it!
Code: ALPHA
🚨Get premium: algoalpha.io
🛜Get FREE signals: discord.gg/xCmqTVRexz
❓Do you have feedback or indicator ideas? Join our server to tell us about it!
Disclaimer
The information and publications are not meant to be, and do not constitute, financial, investment, trading, or other types of advice or recommendations supplied or endorsed by TradingView. Read more in the Terms of Use.