PROTECTED SOURCE SCRIPT
Slope and Concavity : derivative calculations [Fournier-Eaton]
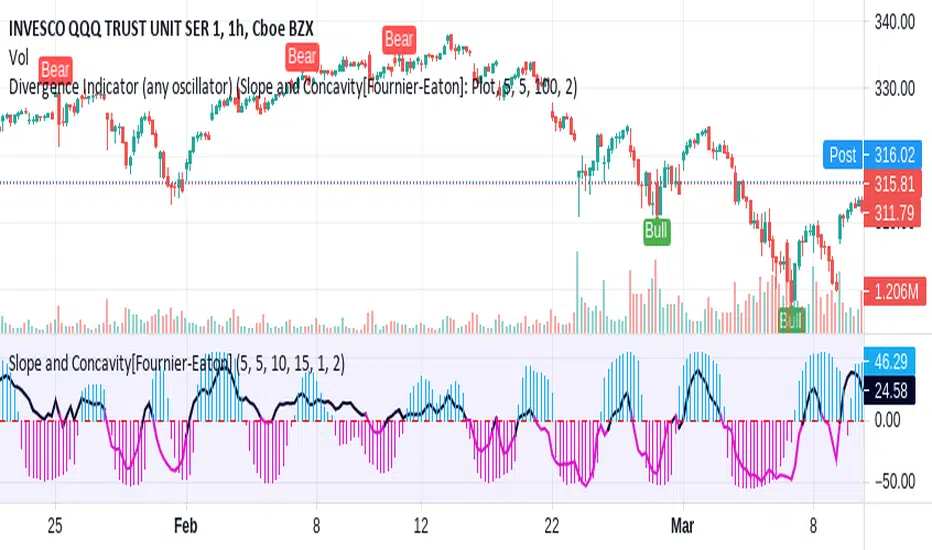
This script calculates the "instantaneous" first and second derivatives in a highly flexible and accurate way: namely, via zero-lag price tracking with increasingly narrow sample windows for sequential secant approximation tending towards the tangent. The slope of this tangential is the first derivative, i.e., slope.
Paired with a divergence indicator this can be a powerful tool for trend analysis.
The Script Works As Follows
Pair this with any indicator that will accept arbitrary input (i.e., from other indicators) select slope or concavity (first or second derivative) to get a lead on trend changes that are often difficult to approximate with the eye during hectic markets.
This is particularly useful as an augmentation for trend shift indicator -- which has been updated.
Paired with a divergence indicator this can be a powerful tool for trend analysis.
The Script Works As Follows
- The slope (first derivative) is represented in line form
- Note that crossing through zero, the slope indicates a change in trend direction.
- The concavity (second derivative) is represented in histogram form
- Positive concavity indicates a shape like an upward bowl, negative is like a downward bowl, and crossing through zero is an inflection point.
Pair this with any indicator that will accept arbitrary input (i.e., from other indicators) select slope or concavity (first or second derivative) to get a lead on trend changes that are often difficult to approximate with the eye during hectic markets.
This is particularly useful as an augmentation for trend shift indicator -- which has been updated.
Disclaimer
The information and publications are not meant to be, and do not constitute, financial, investment, trading, or other types of advice or recommendations supplied or endorsed by TradingView. Read more in the Terms of Use.