PROTECTED SOURCE SCRIPT
Hilega Milega(by NK sir) - @AM
Updated
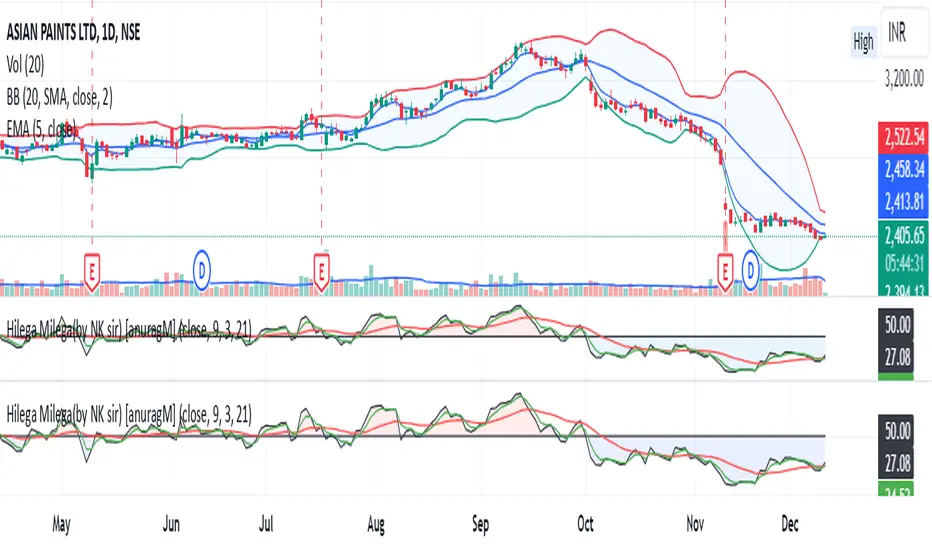
Price Volume Strength(PVS) Indicator script has been developed based on Nitish Kumar Sir's concepts. This script uses RSI(9) along with 3 EMA and 21 WMA . 3 EMA and 21 WMA graphs have been plotted on RSI (9). RSI value above 50 will be considered as 'BUY' zone and RSI value below 50 will be considered as 'SELL' zone.
When 21 WMA ( Volume Strength) and 3 EMA (Price Strength) crosses RSI from above (that means both of these will go below RSI), it is a Buy signal.
When 21 WMA ( Volume Strength) and 3 EMA (Price Strength) crosses RSI from below (that means both of these will go above RSI), it is a Sell signal.
When 21 WMA ( Volume Strength) and 3 EMA (Price Strength) crosses RSI from above (that means both of these will go below RSI), it is a Buy signal.
When 21 WMA ( Volume Strength) and 3 EMA (Price Strength) crosses RSI from below (that means both of these will go above RSI), it is a Sell signal.
Release Notes
Updated overlayRelease Notes
Updated script name.If script is getting added to main chart panel, right click on the screen->choose option 'Move To'->choose option 'New Panel Below'
Release Notes
Updated OverlayRelease Notes
UpdateRelease Notes
Removed RSI overbought and oversold levels value inputs.Release Notes
I have added the Squeeze Momentum Indicator developed by LazyBear along with Hilega Milega.This will help in identifying the Bollinger band Blast.
Red crosses on the midline show that the market just entered a squeeze ( Bollinger Bands are within Keltner Channel). This signifies low volatility, the market preparing itself for an explosive move (up or down). Green crosses signify "Squeeze release".
Release Notes
The script/indicator name has been updated. It will show "HM(by NK sir) & Squeeze momentum by LB [anuragM]" on adding to the chart.Release Notes
Removed the Squeeze momentum indicator as it wasn't giving accurate resultsRelease Notes
Updated the indicator descriptionDisclaimer
The information and publications are not meant to be, and do not constitute, financial, investment, trading, or other types of advice or recommendations supplied or endorsed by TradingView. Read more in the Terms of Use.