PROTECTED SOURCE SCRIPT
Extended Floor Trader Pivots
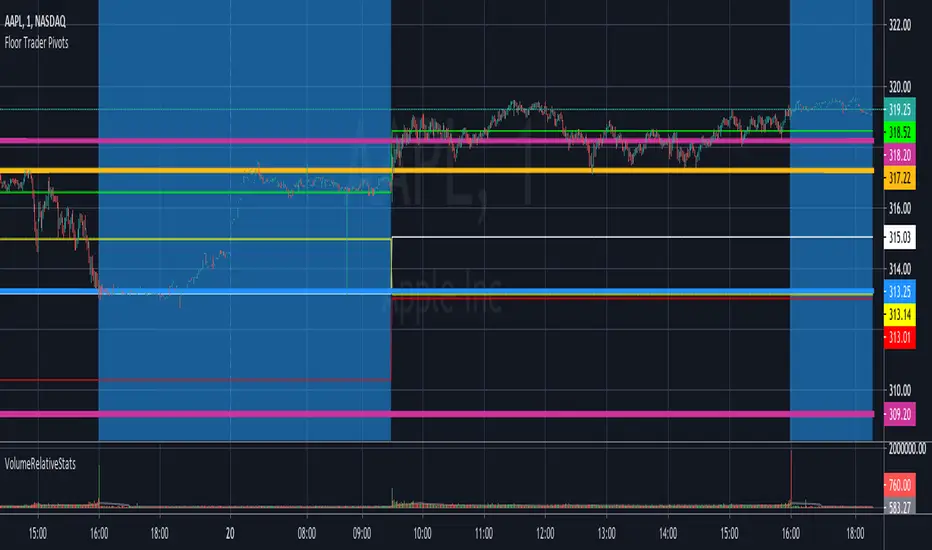
The Floor Trader Pivots indicator is a technical indicator that has long been used in the pits of exchanges. They define an equilibrium point called the primary pivot point or central pivot. Through much research, I can find no one to directly credit for establishing the original calculations which are used in this indicator. The original formulas calculate the primary pivot point (PP) and support/resistance levels based off the PP. Most pivot indicators only derive two support/resistance levels (R1, S1, R2, S2). This indicator provides the PP level as well as four additional support/resistance levels (R1-4, S1-4). This indicator also provides standard Open, High, Low, and Close levels. The calculations are as follows:
PP = (High + Low + Close) / 3
R1 = (PP * 2) - Low
S1 = (PP * 2) - High
R2 = (PP - S1) + R1
S2 = PP - (R1 - S1)
R3 = (PP - S2) + R1
S3 = PP - (R2 - S1)
R4 = (PP - S2) + R2
S4 = PP - (R2 - S2)
Pivot levels can be calculated for any time frame. This indicator provides Weekly, Monthly, Quarterly, and Yearly plots at each pivot level (PP - R4/S4).
This indicator can be used for a variety of different trading strategies and is widely used in equity markets, but can also be applied to Forex and Futures markets. It is most often used as profit taking/loss limiting levels as well as identifying possible areas for trend reversals.
Disclaimer
The information and publications are not meant to be, and do not constitute, financial, investment, trading, or other types of advice or recommendations supplied or endorsed by TradingView. Read more in the Terms of Use.