OPEN-SOURCE SCRIPT
Colorful Channel
Updated
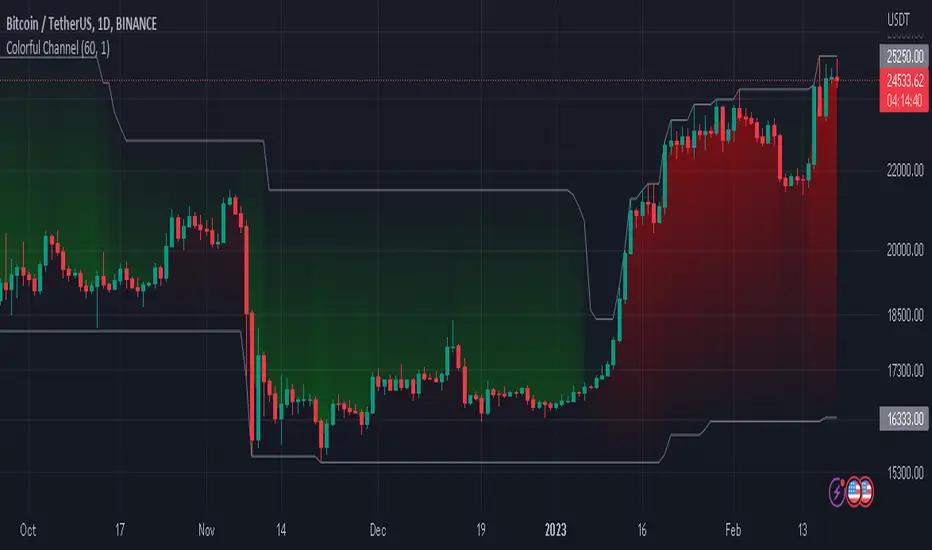
what is "Colorful Channel"?
it is a overbought - oversold indicator.
what it does?
It fills the area between the upper band of the channel and the price line with green, the area between the lower band of the channel and the price line with red color and applies a transparency to these colors according to the distance of the price from the channel lines. thus allowing users to get an idea of ??the current value of the price.
how it does it?
subtracts the percentage of the price from the lower channel from the transparency ratio of the red color, and the percentage of the price from the upper band from the transparency ratio of the green color. thus, a different transparency value is obtained for each percentile. In addition, the transparency rate can be changed with a multiplier determined by the users.
how to use it?
In the "lenght" section, you select the number of bars that the indicator will base backwards on. For example, if length=100, the indicator determines the upper and lower bands according to the distances from the highest and lowest values ??within 100 bar. so the length part works like donchian channels.
You can change the transparency ratio of the colors in the "transp" section.
[url= 1 saat transp] 1 saat transp
[url= yan trend] yan trend
[url= 4 saat] 4 saat
it is a overbought - oversold indicator.
what it does?
It fills the area between the upper band of the channel and the price line with green, the area between the lower band of the channel and the price line with red color and applies a transparency to these colors according to the distance of the price from the channel lines. thus allowing users to get an idea of ??the current value of the price.
how it does it?
subtracts the percentage of the price from the lower channel from the transparency ratio of the red color, and the percentage of the price from the upper band from the transparency ratio of the green color. thus, a different transparency value is obtained for each percentile. In addition, the transparency rate can be changed with a multiplier determined by the users.
how to use it?
In the "lenght" section, you select the number of bars that the indicator will base backwards on. For example, if length=100, the indicator determines the upper and lower bands according to the distances from the highest and lowest values ??within 100 bar. so the length part works like donchian channels.
You can change the transparency ratio of the colors in the "transp" section.
[url=
[url=
[url=
Release Notes
Fills have been developed.Open-source script
In true TradingView spirit, the author of this script has published it open-source, so traders can understand and verify it. Cheers to the author! You may use it for free, but reuse of this code in publication is governed by House rules. You can favorite it to use it on a chart.
Disclaimer
The information and publications are not meant to be, and do not constitute, financial, investment, trading, or other types of advice or recommendations supplied or endorsed by TradingView. Read more in the Terms of Use.