OPEN-SOURCE SCRIPT
Colorful Regression
Updated

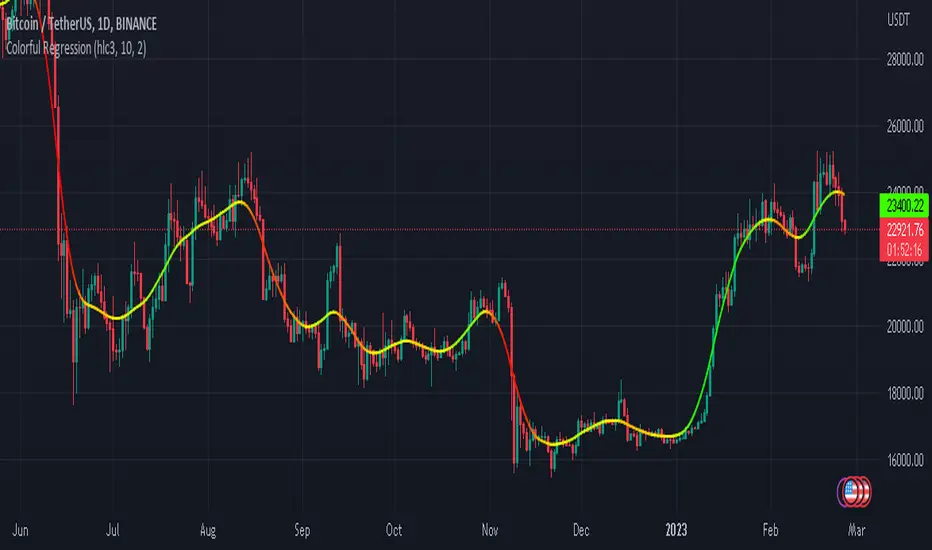
Colorful Regression is a trend indicator. The most important difference of it from other moving averages and regressions is that it can change color according to the momentum it has. so that users can have an idea about the direction, orientation and speed of the graph at the same time. This indicator contains 5 different colors. Black means extreme downtrend, red means downtrend, yellow means sideways trend, green means uptrend, and white means extremely uptrend. I recommend using it on the one hour chart. You can also use it in different time periods by changing the sensitivity settings.
Release Notes
alarm added.The standard deviation has been added to make it suitable for different time periods, but it may still be good to manually adjust the colors for daily and higher timeframes.
linewidth added.
now more sensitive to extreme price movements.
Release Notes
added plotshape.Release Notes
-we now use a special MA that gives a later but much more accurate signal. This function determines an average price by taking into account not only the candles before it, but also the candles after it. Although this causes us to receive signals late, we can prevent this delay with the momentum we use. We also understand momentum from colors. in other words, we can have an idea about both momentum and average price with a single indicator. -the color changed, redder and greener colors are now used for extreme momentum.
Release Notes
offset fixed.Release Notes
The length limit has been increased to 1000.Release Notes
bugs fixed.Release Notes
edit.Release Notes
buy sell signal added again.Release Notes
added label on price scale.Open-source script
In true TradingView spirit, the author of this script has published it open-source, so traders can understand and verify it. Cheers to the author! You may use it for free, but reuse of this code in publication is governed by House rules. You can favorite it to use it on a chart.
Disclaimer
The information and publications are not meant to be, and do not constitute, financial, investment, trading, or other types of advice or recommendations supplied or endorsed by TradingView. Read more in the Terms of Use.