OPEN-SOURCE SCRIPT
Updated [blackcat] L1 Visual Volatility Indicator
Hey there! Let's get into the details about dynamic rate indicators, how they work, their importance, usage, and benefits in trading.
Dynamic rate indicators are essential in trading as they help traders assess the volatility and risk level of the market, so they can make the right trading strategies and risk management measures.
When it comes to the importance of dynamic rate indicators, they provide critical information about market volatility, which is super important for traders. Traders can use this information to understand the risk level of the market, determine market stability and instability, and adjust trading strategies based on volatility changes.
Now let's talk about the usage of dynamic rate indicators. They have different usage times for different trading strategies and market environments. Generally, when market volatility is low, traders can take advantage of the opportunity to do trend tracking or oscillating trades. When market volatility is high, traders can take a more conservative approach, such as using stop-loss orders or reducing position sizes.
Using dynamic rate indicators can bring several benefits. First, they can help traders evaluate the risk level of the market, so they can develop suitable risk management strategies. Traders can adjust stop-loss and take-profit levels based on changes in volatility to control risk. Second, dynamic rate indicators provide information about market trends and price fluctuations, helping traders make wiser trading decisions. Traders can determine entry and exit points based on the signals of dynamic rate indicators. Lastly, dynamic rate indicators play a significant role in option pricing. Implied volatility helps traders evaluate option prices and market expectations for future volatility, so they can carry out option trades or hedging operations.
In conclusion, dynamic rate indicators are essential for traders as they help assess market volatility and risk levels, develop suitable trading strategies and risk management measures, and increase trading success and profitability. Remember that different indicators are suitable for different types of markets, so it is essential to choose the right one for your specific trading needs.
This indicator is a powerful tool for traders who want to stay ahead of the market and make informed trading decisions. By analyzing trends in volatility, this indicator can provide valuable insights into market sentiment and help traders identify potential trading opportunities.
One of the key advantages of the [Blackcat] L1 Visual Volatility Indicator is its ability to adapt to changing market conditions. The channel structure it constructs based on ATR characteristics provides a framework for tracking volatility that can be adjusted to different timeframes and asset classes. This allows traders to customize the indicator to their specific needs and trading style, making it a versatile tool for a wide range of trading strategies.
Another advantage of this indicator is its use of gradient colors to differentiate between Bullish and Bearish volatility. This provides a visual representation of market sentiment that can help traders quickly identify potential trading opportunities and make informed decisions. Additionally, the use of Fibonacci's long-term moving average to define the sideways consolidation area provides a reliable framework for identifying key levels of support and resistance, further enhancing the indicator's usefulness in trading.
In conclusion, the [Blackcat] L1 Visual Volatility Indicator is a powerful tool for traders looking to stay ahead of the market and make informed trading decisions. Its ability to adapt to changing market conditions and use of gradient colors to differentiate between Bullish and Bearish volatility make it a versatile and effective tool for a wide range of trading strategies. By incorporating this indicator into their trading arsenal, traders can gain valuable insights into market sentiment and improve their chances of success in the markets.
Release Notes
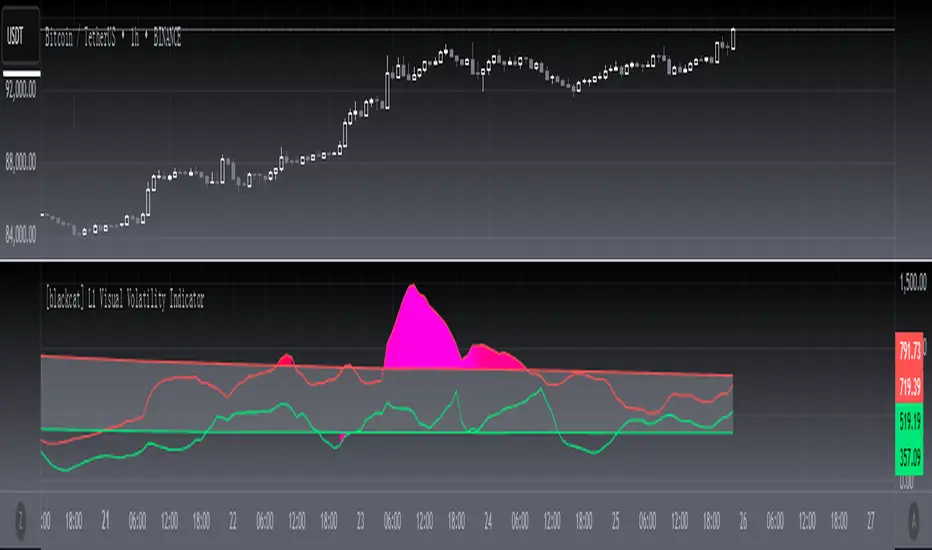
OVERVIEWThe [blackcat] L1 Visual Volatility Indicator provides a visual representation of market volatility using smoothed bands derived from the Average True Range (ATR). This indicator helps traders identify periods of high and low volatility by plotting dynamic upper and lower bands on the chart. The use of gradient colors enhances visualization, making it easier to interpret changes in volatility 📊🎨.
FEATURES
Calculates True Range, Average True Range (ATR), and Standard Deviation of ATR:
Length: Number of bars used for calculations.
Multiplier: Factor applied to standard deviation for band calculation.
Plots smoothed upper and lower bands with gradient colors:
Bands change color based on the Relative Strength Index (RSI), providing additional context.
Upper Band: Red when above smoothed value, otherwise transparent.
Lower Band: Lime green when below smoothed value, otherwise transparent.
Fills between bands to highlight areas of high and low volatility visually.
Uses the Arnold Moving Average (ALMA) for smoothing bands, ensuring clear trend identification.
HOW TO USE
Add the indicator to your TradingView chart by selecting it from the indicators list.
Adjust the length parameter to control the sensitivity of the bands.
Set the multiplier to define how wide the bands should be relative to the ATR's standard deviation.
Observe the colored bands and filled areas to gauge market volatility.
Use this information alongside other technical analysis tools for more informed trading decisions.
LIMITATIONS
The indicator may not capture all nuances of price action during extreme volatility events.
Users should test different settings to find optimal parameters for their specific assets and timeframes.
The effectiveness of the indicator may vary across different market conditions.
NOTES
Ensure that you have sufficient historical data available for accurate calculations.
Test the indicator thoroughly on demo accounts before applying it to live trading 🔍.
Experiment with various lengths and multipliers to achieve the desired balance between responsiveness and smoothness.
Open-source script
In true TradingView spirit, the creator of this script has made it open-source, so that traders can review and verify its functionality. Kudos to the author! While you can use it for free, remember that republishing the code is subject to our House Rules.
Avoid losing contact!Don't miss out! The first and most important thing to do is to join my Discord chat now! Click here to start your adventure: discord.com/invite/ZTGpQJq 防止失联,请立即行动,加入本猫聊天群: discord.com/invite/ZTGpQJq
Disclaimer
The information and publications are not meant to be, and do not constitute, financial, investment, trading, or other types of advice or recommendations supplied or endorsed by TradingView. Read more in the Terms of Use.