OPEN-SOURCE SCRIPT
Streamer Watermark

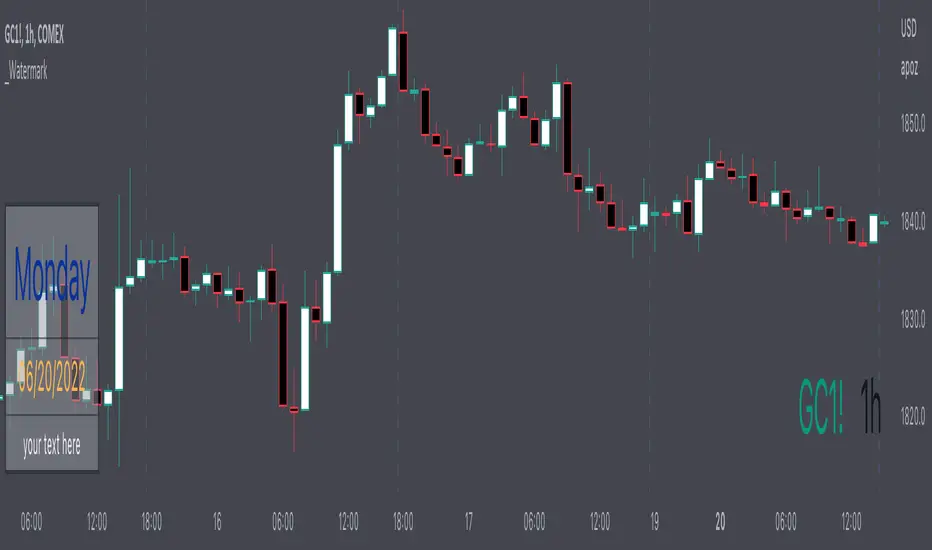
This unique indicator doesn’t help you trade but it makes your charts look super clean and professional in images and live streams! This indicator works by displaying two tables. The first table has day of the week, date, and free form text. The second table has ticker symbol and timeframe of the current chart.
Everything about the tables and the cells is completely controllable by the user! Here is a breakdown of how customizable the user can make this indicator:
Table:
Cells:
Input Text:
Notes
Use text size “Auto” if viewing the same chart on desktop and on smart phone (Auto makes the text scale based upon screen size)
Gallery


Disclaimer
Please read the TradingView House Rules carefully before using this indicator to add text, symbols, characters, or anything else to your charts and posting on TradingView Ideas or Scripts. This indicator and the author are not responsible for users not reading, fully understanding, and abiding by TradingView’s House Rules. Please watermark responsibly.
Everything about the tables and the cells is completely controllable by the user! Here is a breakdown of how customizable the user can make this indicator:
Table:
- Toggle each table to be displayed on or off
- Move each table into 9 different locations around the chart
- Move each table separately
- Table background color and transparency
- Table border color and transparency
- Table border width
- Table frame width
Cells:
- Each cell can be individually toggled on or off (the table will resize dynamically)
- Cell text color and transparency
- Text size with 6 different options
- Date format with 12 different formats
Input Text:
- Text
- Emoji
- Text & emojis
- ASCII characters
- Symbols
- Anything that can by copied and pasted
- Any combination of the above
Notes
Use text size “Auto” if viewing the same chart on desktop and on smart phone (Auto makes the text scale based upon screen size)
Gallery
Disclaimer
Please read the TradingView House Rules carefully before using this indicator to add text, symbols, characters, or anything else to your charts and posting on TradingView Ideas or Scripts. This indicator and the author are not responsible for users not reading, fully understanding, and abiding by TradingView’s House Rules. Please watermark responsibly.
Open-source script
In true TradingView spirit, the author of this script has published it open-source, so traders can understand and verify it. Cheers to the author! You may use it for free, but reuse of this code in publication is governed by House rules. You can favorite it to use it on a chart.
Disclaimer
The information and publications are not meant to be, and do not constitute, financial, investment, trading, or other types of advice or recommendations supplied or endorsed by TradingView. Read more in the Terms of Use.