OPEN-SOURCE SCRIPT
Adjusted Average Volatility
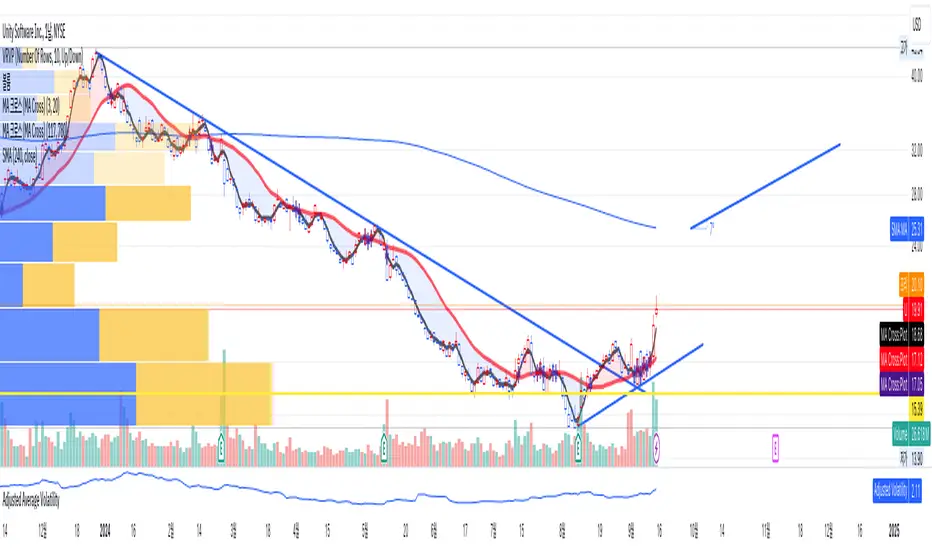
This Pine Script calculates the average volatility over the past 20 bars by taking the difference between the high and low prices. It then adjusts this volatility based on the previous closing price: if the price is below $20, the volatility is multiplied by 2, and if it’s above $20, the volatility is multiplied by 1.5. The adjusted volatility is then plotted on the chart, helping traders visualize how volatility changes relative to the asset's price level.
Open-source script
In true TradingView spirit, the creator of this script has made it open-source, so that traders can review and verify its functionality. Kudos to the author! While you can use it for free, remember that republishing the code is subject to our House Rules.
Disclaimer
The information and publications are not meant to be, and do not constitute, financial, investment, trading, or other types of advice or recommendations supplied or endorsed by TradingView. Read more in the Terms of Use.